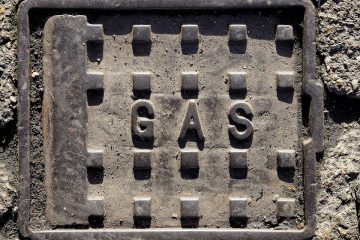
Lowering Desalination’s Energy Footprint: Lessons from Israel
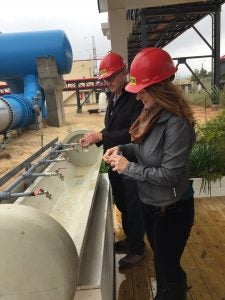
Kate Zerrenner and Leon Kaye of Triple Pundit tasting desalinated water at Sorek.
There’s an old expression that whisky is for drinking and water is for fighting over. The Legislative Session is upon us again in Texas, and count on water being an issue, as it always is in this drought and flood-prone state.
To start, this Session will see the approval of the 2017 State Water Plan (SWP), which is done in five-year cycles. In the five years since the last plan, Texas has gone from the throes of a devastating drought to historic flooding, which resulted in some reservoirs being full for the first time in 15 years.
Moreover, as more people move to Texas and climate change advances, there will be greater strain on the state’s water supplies. According to the SWP, Texas is already in a tighter situation than it was just five years ago: Surface water and groundwater availability will be 5 percent lower in 2060 compared to predictions in the 2012 plan, and existing water supplies are expected to drop by 11 percent between 2020 and 2070. Where are we supposed to get the water we need?
One place we could look to for ideas is Israel, which relies heavily on desalination – or the process of removing salt from water – to meet its needs. During Session, there will likely be calls to implement and fund desalination projects in Texas, which can help ensure water supplies in the future. But we need to take a page from Israel’s book, and create plans and policies that are thoughtful about reducing the technology’s energy footprint.
Cutting desal costs in Israel
Sixty percent of Israel is desert, and the rest is semiarid. (Texas, in comparison, is about 10 percent desert.) The harsh, dry climate means ensuring water supplies is a top priority, and as a result Israel gets up to 75 percent of its potable water from desalination. To put that into perspective, the entire state of Texas currently produces about 123 million gallons per day with desalination, or roughly 465,606 cubic meters per day. The Sorek Desalination Plant outside Tel Aviv, one of many in the country, alone produces about 624,000 cubic meters per day/ 164 MGD.
Lowering Desalination’s Energy Footprint: Lessons from Israel
Click To Tweet
I recently toured the Sorek plant, the largest desal plant in the world, which provides about 20 percent of Israel’s potable water. One of the things that struck me, other than the sheer size, was how energy was a front-and-center concern. Since desal plants need constant power – and a lot of it – energy is by far the most expensive part of running the plant. Groundwater desal is highly energy-intensive, and seawater even more so – power is estimated at about half of seawater desal plants’ entire operating costs.
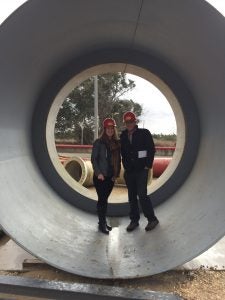
Kate Zerrenner and Leon Kaye of Triple Pundit standing in a desalination pipe at Sorek.
Three tactics help ease these costs and maintain plant reliability:
- On-site power generation: Two of the other biggest plants in Israel are located next to power plants, which means less energy lost during transmission and distribution, as well as greater reliability. One of those, Hadera, is located near a gas-fired power plant, which requires significantly less water than coal. Israel could further cut desal’s water footprint by installing no-water resources like wind turbines or solar panels on-site, as Texas is trying to do.
- Energy efficiency: Israel is home to the two most energy-efficient desal facilities in the world: Hadera and Sorek, respectively. Sorek looks to reduce its energy consumption at every step of the process, like its energy recovery system, which captures energy from the brine stream that would have otherwise been wasted and uses it to power pumps. Unfortunately, U.S. desal plants tend to be behind the tech curve because the approval process takes so long. With a robust, more streamlined approvals process and newer technology, American plants could maximize efficiency as Israel does.
- Taking advantage of smart pricing: Israel has variable electricity rates, meaning they change depending on the season, day of the week, and time of day. Sorek negotiated a lower electricity rate in exchange for participating in the demand response program – in this case, agreeing to do the most production at night when both electric demand and prices are lower. In fact, Sorek was built to be responsive to peak demand: It can change its operating capacity from 30 to 120-percent production in less than five minutes, in response to the electricity rate. Moreover, by enabling customers to alter their energy-use based on peak demand and pricing, Israel’s entire electric grid benefits from greater stability. Leveraging demand response could help desalination in Texas and other states that deal with drought, like California, be more energy- and water-efficient.
Desal in Texas
So, what does all this mean for Texas? In his recent book, Let There Be Water, Seth M. Siegel writes about how native Texan Lyndon B. Johnson shared former Israeli Prime Minister David Ben-Gurion’s approach to water. Ben-Gurion saw the promise of desal and LBJ seemed to view the technology as the future for ensuring America’s water supplies, especially in dry areas like his own beloved Texas Hill Country. Today, Texas is home to the largest inland desal facility in the world, the Kay Bailey Hutchison Desalination Plant.
“Desalination is turning the water issue from a zero-sum game to a win-win.”
LBJ may have been the first Texas proponent of desal, but he certainly is not the last. IDE, the company behind Sorek (and the new Carlsbad facility in San Diego), opened an office in Austin a few years ago to look for potential sites in the state. Further, Governor Greg Abbott, recently paid a visit to Sorek, and many legislators who understand the importance of safeguarding water supplies are supportive of desal.
In the SWP 2017, about 2.7 percent of the proposed supply strategies are for desalination. That’s a relatively small percentage, but it translates to a giant energy footprint. When it comes to desal, Texas leaders need to understand that using low-water energy sources like solar and wind is important, energy efficiency is critical, and having smart energy policy that supports a more flexible grid – like Israel’s variable pricing – rounds it out.
As Texas embarks on another round of figuring out how to solve our water woes, we could take a lesson from Israel. The country has figured out how to maximize desalination’s potential, while minimizing its energy footprint. As Uri Ginott of EcoPeace Middle East said, “Desalination is turning the water issue from a zero-sum game to a win-win. Every drop doesn’t have to come at the expense of another.” When we live in a typically dry place that’s only expected to get drier, being comprehensive about our water solutions sets us all up to win.
Editor’s note: Kate was a guest of Vibe Israel, a non-profit organization leading a tour called Vibe Eco Impact in December 2016, which explores sustainability initiatives in Israel.
 (EDF Attorney Ben Levitan co-authored this post)
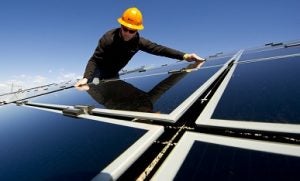 From coast to coast – and especially places in between – jobs were the most pressing concern for American voters. So Trump has promised he will create 25 million new ones over the next decade by, among other things, reviving America’s declining coal industry.