Enviroshop – About Magazine

Food waste, guilt and the millennial mom: how companies can help

By Jenny Ahlen

edf-business-of-food-blog-graphic_shelton-grp_12-7-16I spend a lot of time these days thinking about food waste.

Why? First, I’m the mother of a toddler who oscillates between being a bottomless pit, easily cleaning her plate, to being a picky eater who only takes a couple of bites before the bulk of her meal ends up in the trash.

Second, I’m married to a chef who, because he’s a smart businessman, runs his kitchen with the precision of a comptroller: wasted food means lost profit, so every scrap of food is utilized wherever possible.

Finally, I interface almost daily with Walmart, the world’s largest grocer. Walmart recently pledged to root out 1 gigaton of greenhouse gas reductions from its global supply chain, and I’m certain that food waste will play an integral part in reaching that goal.

But before you conclude that I’m an outlier—some sort of obsessive, “food waste weirdo”— a recent study shows that I’m not the only one struggling with this issue:

Now we all know that just because one feels guilty about something doesn’t mean one’s behavior will change.  Cost, however, is a frequent driver of behavior, so consider these numbers:

In other words, 2.5-4% of the 2015 US median household income is being thrown away! That’s bad news for our wallets—and our planet (NRDC estimates that food rotting in landfills accounts for 16% of U.S. methane emissions).

So it’s a no-brainer that wasting food serves no one’s interests.  What’s not so clear is: what can be done about it?

A business opportunity… with a coveted consumer

This is where I see a real opportunity for grocers—like Walmart—and the food companies that fill their shelves. For the most part, these companies are talking non-stop these days about how to win over the most coveted customer of all, the “millennial mom”.

Inviting millennial moms to be partners on eliminating food waste could be the perfect strategy. They jenny_helen_expertare young (meaning they have years of brand loyalty ahead of them), cost-conscious and environmentally engaged; saving them money while alleviating their food waste guilt is a clear win-win.

I’m not saying this will be easy; that same study reveals that real barriers exist:

However, while conceding that it’s difficult (if not downright un-wise) to portray millennial moms as a monolithic group, marketing profiles of these women consistently portray them as, a.) hungry for information about products; and b.) willing to take action on issues… but only if roadblocks or impediments have been removed.

So, grocers and food companies, how can you burnish your brand with millennial moms while making a real dent in food waste?

Step number 1: engage and educate

Run marketing campaigns, both in-store and out, that will inform these coveted customers on:

  • Proper handling and storage of their food to minimize spoilage; and
  • How to fully utilize their food purchases. In other words, teach them to think like my husband, the chef, so they can make use of scraps and leftovers.

Step number 2: make it easy

Design and implement initiatives that make for fun, easy adoption:

  • Clarify date labeling so that perfectly good food isn’t perceived as bad. The USDA just requested that companies switch to “best if used by” language to give consumers more accurate guidance.
  • Suggest meals that enable moms to buy just what they need—and use it up. There’s a real business opportunity here: did you know that, as of 4 pm each day, 80% of mom’s don’t know what’s for dinner that night? Suggesting recipes that will be totally consumed will make her life easier!
  • Inspire composting (and discount composters)… their garden will thrive because of you! Or help make curbside composting possible like in Boulder, Seattle and San Francisco.
  • Be creative… people love to compete! Only 13.5% think that their household wastes more than their average neighbor (study). Help people understand that they may in fact be wasting way more food and money than their friends, family, and neighbors to motivate them to do something about it.

In the meantime, I will carry on, hopeful that while my daughter learns to clean her plate, an array of giant food companies and grocers will take up the mantle of tackling food waste on a massive scale.

Read more

At last: EPA promulgates nanomaterial reporting rule

By Richard Denison

Richard Denison, Ph.D.is a Lead Senior Scientist. Lindsay McCormick is a Project Manager.  

nanomaterial-infographic

Today, EPA issued its long-awaited rule to gather risk-relevant information on nanoscale materials. The new rule will finally allow EPA to obtain basic data on use, exposure, and hazards from those that manufacture or process these materials, which has long been recognized by experts as essential to understand and manage their potential risks.

Nanomaterials – a diverse category of materials defined mainly by their small size – often exhibit unique properties that can allow for novel applications but also have the potential to negatively impact our health and the environment.  Some nanomaterials:  more easily penetrate biological barriers than do their bulk counterparts; exhibit toxic effects on the nervous, cardiovascular, pulmonary, and reproductive systems; or have antibacterial properties that may negatively impact ecosystems or lead to resistance.

Numerous expert bodies have identified the need for the kinds of information on nanomaterials EPA will now be able to collect, including the National Academy of Sciences, the National Nanotechnology Initiative, and EPA’s Office of Research and Development.  The Organization for Economic Cooperation and Development (OECD) published a report last year noting that the number of products containing nanomaterials increased fivefold in the global market between 2006 and 2011, and are being used in hundreds of new products ranging from cosmetics and personal care products to clothing and textiles, solar cells, plastics for the automotive and aircraft industries, and food packaging.

EPA’s new rule institutes a one-time reporting requirement for existing nanomaterials, as well as a standing one-time reporting requirement for new nanomaterials before they are manufactured.  Companies that manufacture, import or process existing nanomaterials, or intend to start doing so for a new nanomaterial, are required to submit the following categories of “reasonably ascertainable” information to EPA:  chemical identity, production volume, methods of manufacture and processing, exposure and release information, and available environmental and health impacts data.  By collecting such data, EPA will finally be able to draw a clearer picture of the nanomaterials in and entering commercial use, and better determine whether action to mitigate risk is needed, on a case-by-case basis.

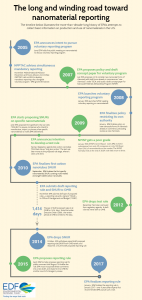
This basic rule has been a very long time coming.  As illustrated in the graphic above, EPA has been attempting – for over a decade – to issue such a rule to gather even this most basic information on nanomaterials in the U.S. market.  Over the years, we have blogged extensively on EPA’s slow progress, due to opposition from both industry and other parts of the Federal government at every step.

There are a number of notable aspects of what is included – and not included – in the final rule:

  • It applies both to nanoscale materials already in commerce and to new nano forms of existing chemicals that companies intend to make or process in the future. (Wholly new nanoscale chemicals would be required to be reviewed under TSCA’s new chemicals provisions.)
  • In promulgating the rule, EPA affirmed its broad authority to collect existing information under section 8(a) of TSCA, rejecting industry arguments that such authority was highly constrained.
  • EPA removed reporting exemptions it had proposed for nanoclays and zinc oxide, and rejected industry calls to include numerous additional exemptions.

The rule is not perfect and omits reporting EDF and others urged be included.  For example:

  • Aggregates of nanoscale particles must fall within the 1-100 nanometer (nm) range to be reportable. We argued that aggregates comprised of nanoparticles between 1-100 nm be reported even if the aggregate is larger, given that such aggregates can often disaggregate in the environment or during use.
  • Companies that submitted a pre-manufacture notice (PMN) for a nanoscale material at any time since 2005 do not have to report for that material. Our concern is that this will miss new information on that material that has been developed since the PMN was reviewed.
  • Chemical substances “formed at the nanoscale as part of a film on a surface” are exempted from reporting. We argued that such films can break down or erode over time especially if exposed to the elements, potentially releasing the nanoscale materials.

Still, with this rule finally finalized, EPA can at last begin to get basic risk-relevant information needed to make sound decisions about which materials and uses present concerns and which do not.


For more detail on the history of this rule, see these earlier blog posts:


Read more

FDA finds more perchlorate in more food, especially bologna, salami and rice cereal

By Tom Neltner

Tom Neltner, J.D.is Chemicals Policy Director and Maricel Maffini, Ph.D., Consultant

Last month, the Food and Drug Administration’s (FDA) scientists published a study showing significant increases in perchlorate contamination in food sampled from 2008 and 2012 compared to levels sampled from 2003 to 2006. The amount of perchlorate in foods infants and toddlers eat went up 34% and 23% respectively. Virtually all types of food had measurable levels of perchlorate, up from 74%. These increases are important because perchlorate threatens fetal and child brain development. As we noted last month, one in five pregnant women are already at great risk from any perchlorate exposure. The FDA study doesn’t explain the increase in perchlorate contamination. Yet, it’s important to note that there is one known factor that did change in this time period: FDA allowed perchlorate to be added to plastic packaging.

Reported perchlorate levels in food varied widely, suggesting that how the food was processed may have made a significant difference. The increase in three foods jumped out to me:

  • Bologna: At a shocking 1,557 micrograms of perchlorate per kilogram (µg/kg), this lunchmeat had by far the highest levels. Another sample had the fifth highest levels at 395 µg/kg. Yet a quarter of the other bologna samples had no measurable perchlorate. Previously, FDA reported levels below 10 µg/kg.
  • Salami: One sample had 686 µg/kg giving it a third ranking. Other samples showed much lower levels and six of the 20 had no detectable levels of perchlorate. Previously, FDA reported levels below 7 µg/kg.
  • Rice Cereal for Babies: Among baby foods, prepared dry rice cereal had the two highest levels with 173 and 98 µg/kg. Yet, 15 of the 20 samples had non-detectable levels of perchlorate. Previously, FDA reported levels less than 1 µg/kg.

The increases are disturbing in light of the threat posed by perchlorate to children’s brain development and the emerging science showing the risk at lower levels is greater than thought a decade ago. The risk is particularly significant for children in those families loyal to those brands with high levels. Unfortunately, FDA’s study does not identify the brand of food tested.

What might explain the increase in perchlorate contamination?

The only action we can document is FDA’s decision in 2005 to allow as much as 12,000 parts per million (ppm) of perchlorate to be added as an anti-static agent to plastic packaging for dry food with no free fat or oil. The packaging can be used for final products or raw materials before or during processing. Even if the final product is a liquid, raw materials such as rice, whey, sugar, starch, or spice may have contacted the perchlorate-laden plastic. The FDA decision was made in late in 2005 and sampling from the first study ended in 2006.

A Freedom of Information Act request by the Natural Resources Defense Council (NRDC) showed that FDA’s decision was based on a flawed and outdated assumption that perchlorate would not migrate into food at significant levels. Tests provided by the manufacturer late in 2015, in response to a food additive petition from NRDC and others, showed that perchlorate did indeed migrate into food, most likely from abrasion as the food flows in and out of the package. The petition asked FDA to reverse its 2005 decision and ban use of perchlorate. When FDA missed the June 2015 statutory deadline for a decision on the petition, NRDC and others sued the agency to force action. The agency told the court that it aims to make a final decision by March 2017.

What does FDA’s analysis say?

For more than 40 years, as part of its Total Diet Study, FDA has collected samples of more than 280 types of food every year from three randomly-selected cities in four regions of the country. It blends the samples from each of the three cities and analyzes the composite sample for various chemicals, such as heavy metals, nutrients, pesticides and other substances. The agency samples more than 50 types of baby food, including three types of infant formula. The agency also tests bottled water but not tap water. The agency does not report the brands sampled.

Periodically, the agency posts the results on its website and publishes studies evaluating its findings. In response to concerns with perchlorate contamination of produce and dairy, FDA published a study in 2008 summarizing the results from samples collected from 2003 to 2006. It provides updates on a webpage dedicated to the chemical.

On December 21, 2016, FDA published its latest article reporting the results for samples collected from 2008 to 2012 and compared them with those collected from 2003 to 2006 using two different statistical methods. The study provides supplementary data that includes the analytical results but does not identify the year or region from which the samples were collected. Neither the article nor the analytical results are yet available on the agency’s webpages dedicated to perchlorate or the Total Diet Study.

FDA estimated dietary intakes for 14 distinct age/sex groups. Infants and toddlers had the highest estimated consumption with 0.36 and 0.43 μg/kg-bw/day respectively.  Infants had a 34% increase in perchlorate exposure compared to the foods purchased before and around the time of FDA’s approval to use perchlorate in food packaging. More than half of the infant exposure came from baby food, including infant formula. Two-year old children’s exposure increased 23%. More than half of their exposure came from dairy products.

What should FDA do?

FDA’s compelling data on the significant increase in perchlorate exposure from the food we feed our children since its approval of perchlorate added to packaging should prompt the agency to act now to ban its use in contact with food. This decision cannot come fast enough. FDA must remedy a problem of its own making, and protect what many of us value the most—our children’s health and their ability to learn and thrive to their fullest potential.

Read more

Cincinnati and Ohio show leadership in identifying and disclosing lead service lines

By Tom Neltner

Tom Neltner, J.D.is Chemicals Policy Director

Transparency is an essential aspect of any successful program to reduce lead in drinking water. Knowing if you have a lead service line (LSL)—the pipe that connects the main under the street to the building—can help you decide whether to use a filter or replace the line. If you are looking for a home to rent or buy, the presence of a LSL can be a factor in your choice. Transparency can also help reassure consumers that their utility is aware of the problem and committed to protecting their health. The challenge for many water suppliers is that they often don’t have perfect information about the presence of LSLs. But incomplete information is not a reason for failing to disclose what is known, what is uncertain, and what is unknown.

In a February 29, 2016 letter to the states, U.S. Environmental Protection Agency (US EPA) asked states to increase transparency by posting on either the state’s website or have it posted on local utilities’ websites:

“the materials inventory that systems were required to complete under the [Lead and Copper Rule] including the locations of lead service lines [LSLs], together with any more updated inventory or map of lead service lines and lead plumbing in the system.”

In response to this letter and systemic issues brought to light about lead in drinking water in the village of Sebring, Ohio and Flint, Michigan, the State of Ohio enacted pragmatic legislation crafted by Governor John Kasich’s administration and the Ohio Environmental Protection Agency (Ohio EPA). Among its supporters was the Ohio Environmental Council. One provision in the law requires community water systems to

“identify and map areas of their system that are known or are likely to contain lead service lines and identify characteristics of buildings served by the system that may contain lead piping, solder, or fixtures . . .”

Utilities must submit the information to Ohio EPA as well as the departments of Health and of Job and Family Services by March 9, 2017 and update this information every five years.

To help utilities comply, Ohio EPA released draft guidance in September 2016 and laid out four resources to identify buildings likely to contain LSLs: 1) code and regulatory changes; 2) historical permit records; 3) maintenance and operation records; and 4) customer self-reporting. It recommended that utilities submit the maps in PDF format and identify areas likely or known to contain LSLs using different colors.

Ohio’s three largest cities, Cincinnati, Cleveland and Columbus, have taken different approaches to LSL transparency. Cincinnati embraced the requirement and took it a step farther.  It provided detailed on-line maps, modeled off Washington DC’s approach, enabling the public to search an address or view a map that tells them whether or not the service line is made of lead or if the material is unknown. The city provides information for both the portion of the service line owned by the utility (referred to as the “public side”) and the line on private property (referred to as the “private side”). It uses the best available information but does not guarantee accuracy.  Users must click on a disclaimer to access the site. Consistent with Ohio EPA guidance, the city invites customers to submit updated information to the utility by email. This level of detail allows any consumer to make informed choices whether they are buying or renting a home, picking a child-care facility, or deciding whether to use a filter.

In contrast, Cleveland has not gone as far as Cincinnati.  It has an on-line address search tool supplemented with static color-coded map. The tool only provides address-specific information on the public side of the service line but not the private side. This risks giving users the false impression that the lack of a LSL on the public side means that there is no LSL when there may still be lead pipe on the private side. However, Cleveland reports that preliminary surveys show that less than 3% of lines on private property as lead pipe.

Cleveland reported to me that it is open to considering an interactive map similar to Cincinnati and providing an option to allow customers to provided updated information.  This interactivity should make it easier for potential renters and homebuyers to scan a neighborhood to identify homes without LSLs.

In response to my inquiry, Columbus reported that it will submit a map similar to Cleveland and make it publicly available within the next month or so.  The map will be a PDF showing areas where their records indicate a home has a publically-owned lead service line. They are evaluating a searchable database as a possible future enhancement.

Replacing lead pipes is one of the best means for reducing the risk of lead exposure from water—a major source of lead after paint. A critical step towards this goal is building an inventory of LSLs, starting with the best available information—what is known and what isn’t known. While it may be a difficult step for a utility to admit it does not know whether the public or private side of a service line is made of lead, it is critical to make this information available in a user-friendly format that allows property owners to update and correct the information. The City of Cincinnati and State of Ohio serve as a model for other communities.

Read more

Why Strategic Choices – and Water – Could Make People More Energy-Efficient

By Kate Zerrenner

At my household, a new year means a new energy and water-use baseline. By that I mean, every month, I look at how much electricity and water I used in comparison to the same month the previous year – so I can try to be as efficient as possible. But I work in the energy field, and I know that’s not a typical New Year’s tradition. Most people don’t examine the trends of their energy-use or spend much time thinking about how to reduce it.

So, what motivates the “average” person to take action and be more energy-efficient? It depends.

A recent study by the Pacific Institute for Climate Solutions and the American Council for an Energy Efficient Economy (ACEEE) looked at the psychology behind individuals’ energy efficiency behavior, and how that information could be used to design more effective programs.

The study came away with some fascinating findings that show electric utilities need to be strategic in the way they create, as well as communicate about, their efficiency programs. Moreover, it led me to believe showing how energy efficiency relates to water – the quality and availability of which many people care about – could help encourage people to be more mindful about their energy use.

Study takeaways

One false assumption often made when designing an efficiency program is, if you give the customer the information and tell them what to do, they will do it. But information alone will not lead people to change their behavior.

Information alone will not lead people to change their behavior.

In order to ensure people actually hear and act on the message, utilities should consider:

  • Tailoring messaging: Rather than simply talking about saving energy, the program could emphasize improving air quality or saving money, depending on your audience. For example, the study concludes “conservatives are more likely to respond to messages about ‘wasted energy’ or ‘climate change’ than to messaging about ‘global warming’.” But first, utilities have to learn more about their customers to understand the language that will work best.
  • The right messenger: People are social animals, and we are more likely to listen to a message from someone we know and trust. The study found that recruiting trusted leaders from a social network, like a neighborhood or church, would be more effective than having the information come from an outsider.
  • Giving feedback: Letting people know their actions are saving energy makes it more likely they will continue to engage in that behavior. Plus, “the more frequently personalized feedback is given, the more effective it tends to be.” Other studies have shown real-time energy-use feedback can result in up to 12 percent household savings.
  • Using pledges: A commitment to do something – like promising to turn off all appliances when not in use – makes people “more likely to follow through with their planned actions.”

How water could help make people more energy-efficient
Click To Tweet


The energy-water connection

Unless you live near a power plant or in a place with markedly poor air quality, you probably don’t think about how your own energy use can have a direct impact on the environment.

But what if you tied electricity to something more personal, like water?

I live in Austin, and my water comes from the Highland Lakes, a group of manmade reservoirs from the Colorado River just outside the city. I spent every summer as a kid swimming and boating in Lake Travis, part of the Highland group. In the worst year of the Texas drought, the beautiful Lake Travis looked like a mud pit. Businesses and marinas closed because the water no longer made it to what had been the shore. I’ll never forget how that lack of water made me feel, and it still inspires me to use water wisely. 

Every time you turn your lights on, you might as well be turning on the faucet, too. 

Connecting water to power could sway more people into thinking about how they use energy. Traditional power resources – like coal, natural gas, and nuclear – require a significant amount of water to produce energy: It takes an average of 21 gallons of water to produce one kilowatt-hour of electricity. The average American uses about 900 kWh per month – that’s nearly 19,000 gallons of water per person per month just for electricity! So, every time you turn your lights on, you might as well be turning on the faucet, too. If electric utilities made that connection to customers or policymakers, it could make the reality of our energy behavior more tangible.

Energy efficiency is a great way to reduce customers’ bills, save water, and lower pollution. But if utilities want people to take advantage of their energy efficiency programs, the new study from Pacific Institute for Climate Solutions and ACEEE suggests they should consider strategic tactics and messengers when delivering the critical details surrounding efficiency. One way to enhance engagement could be by emphasizing the inextricable link between energy and water, and helping people understand where their water comes from.

How you use electricity in your own home is a personal decision, but having a deeper knowledge of the impacts of those choices could lead to less energy and water waste – and healthier air for us all.

Photo source: iStock/nicolas_

Read more

Super-emitters Are Real: Here Are Three Things We Know

By Daniel Zavala-Araiza

TOC_component

As part of our landmark 16-study series and ongoing work in measuring methane emissions, we previously published a paper that compared and reconciled top-down (airborne-based measurements ) with bottom-up (emissions inventory, using ground-based measurements) emissions.

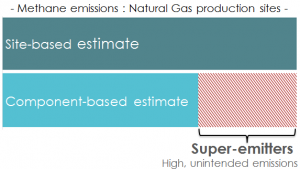
This paper found that 1% of natural gas production sites accounted for 44% of total emissions from all sites, or 10% of sites 80% of emissions; emission estimates were based on facility-wide (site-based) measurements. Sites or equipment that produce disproportionate shares of total emissions are often called “super-emitters”. A big question that remained was what caused some sites to become a super-emitter; this remained a “black box” without additional knowledge about which components or operational conditions within a site could trigger the high-emissions.

In a paper published today in Nature Communications, we zero-in or “open the black boxes” to understand and characterize super-emitters. We look at the emissions from all the equipment and operations present at production sites, and ask which ones could produce emissions at a magnitude and frequency indicative of the expected super-emitting behavior.

Crucially, this new paper compares site-based emission estimates to component-by-component aggregations of sources of emissions from production sites. We find that this new component-based emissions estimate is significantly lower (one third) than the site-based estimate previously reported in the Barnett synthesis study (where this site-based estimate agreed with the flyover estimate).

It’s important to note that while the study took place in the Barnett because of the rich data sets available, this behavior is expected across the US (and even internationally).

By examining this discrepancy, here are three things we learned about methane waste:

  1. Component-based estimates do not explain enough high-emitting sites. From this we learn that some components or activities at production sites are causing wasteful emissions that are not accounted for in current emission inventories. The insufficient contribution from the components or operations that can produce high emission rates when operating “as designed” is indicative of the existence of abnormal process conditions (such as malfunctions or equipment issues) that create pathways for substantial unintended emissions of produced gas.
  2. Routine operating conditions do not explain high-emitting sites. We can now hypothesize that not only is gas escaping, but when and from which sites is constantly changing.
  3. And frequent, or continuous, site-level monitoring is required to help us find and reduce waste from super-emitters.

Further Discussion

Because our new work tells us that super-emitter sites are characterized by abnormal behavior that is unlikely to persist indefinitely, we expect that different sites will be in the high-emitting group at different points in time. Industry claims that most super-emitters are sites with liquid unloadings or tank flashing, but these routine operating conditions do not explain the number of high emitting sites at any moment in time. Our new work tells us that these emissions are coming from unintended malfunctions throughout natural gas development and production.

Additionally, the EPA’s Inventory, which is based on component-level emissions data, is significantly lower than actual methane emissions, due to the omission of super-emitter data from production sites.

Specific sites could be affected by abnormal conditions resulting in their being a super-emitting site at varying points in time. As a consequence, rather than looking to control emissions from a few sites, minimizing emissions requires monitoring approaches that enable efficient and timely responses to the unpredictable nature of when and where a super-emitter will be located.

Current standards for intermittent methane leak detection and repair will continue to miss many of these super-emitting sites. We must have an effective program to continuously monitor for methane waste.

Read more

The United States Could Lead the Next Tech Revolution by Investing in Clean Energy

By Jonathan Camuzeaux

New Risky Business Report Finds Transitioning to a Clean Energy Economy is both Technologically and Economically Feasible

In the first Risky Business report, a bi-partisan group of experts focused on the economic impacts of climate change at the country, state and regional levels and made the case that in spite of all that we do understand about the science and dangers of climate change, the uncertainty of what we don’t know could present an even more devastating future for the planet and our economy.

The latest report from the Risky Business Project, co-chaired by Michael R. Bloomberg, Henry M. Paulson, Jr., and Thomas F. Steyer, examines how best to tackle the risks posed by climate change and transition to a clean energy economy by 2050, without relying on unprecedented spending or unimagined technology. The report focuses on one pathway that will allow us to reduce carbon emissions by 80 percent by 2050 through the following three shifts:

1. Electrify the economy, replacing the dependence on fossil fuels in the heating and cooling of buildings, vehicles and other sectors. Under the report’s scenario, this would require the share of electricity as a portion of total energy use to more than double, from 23 to 51 percent.
2. Use a mix of low- to zero-carbon fuels to generate electricity. Declining costs for renewable technologies contribute in making this both technologically and economically feasible.
3. Become more energy efficient by lowering the intensity of energy used per unit of GDP by about two thirds.

New Investments Will Yield Cost Savings

Of course, there would be costs associated with achieving the dramatic emissions reductions, but the authors argue that these costs are warranted. The report concludes that substantial upfront capital investments would be offset by lower long-term fuel spending. And even though costs would grow from $220 billion per year in 2020 to $360 billion per year in 2050, they are still likely far less than the costs of unmitigated climate change or the projected spending on fossil fuels. They’re also comparable in scale to recent investments that transformed the American economy. Take the computer and software industry, which saw investments more than double from $33 billion in 1980 to $73 billion in 1985. And those outlays continued to grow exponentially—annual investments topped $400 billion in 2015. All told, the United States has invested $6 trillion in computers and software over the last 20 years.

This shift would also likely boost manufacturing and construction in the United States, and stimulate innovation and new markets. Finally, fewer dollars would go overseas to foreign oil producers, and instead stay in the U.S. economy.

The Impact on American Jobs

The authors also foresee an impact to the U.S. job market. On the plus side, they predict as many as 800,000 new construction, operation and maintenance jobs by 2050 would be required to help retrofit homes with more efficient heating and cooling systems as well as the construction, operation and maintenance of power plants. However, they would be offset by a nearly 34 percent loss in the coal mining and oil and gas sectors, by 2050, mainly concentrated in the Southern and Mountain states. As we continue to grow a cleaner-energy economy, it will be essential to help workers transition from high-carbon to clean jobs and provide them with the training and education to do so.

A Call for Political and Private Sector Leadership

Such a radical shift won’t be easy, and both business and policy makers will need to lead the transition to ensure its success. First and foremost, the report asserts that the U.S. government will need to create the right incentives.  This will be especially important if fossil fuel prices drop, which could result in increased consumption.  Lawmakers would also need to wean industry and individuals off of subsidies that make high-carbon and high-risk activities cheap and easy while removing regulatory and financial barriers to clean-energy projects. They will also need to help those Americans negatively impacted by the transition as well as those who are most vulnerable and less resilient to physical and economic climate impacts.

Businesses also need to step up to the plate by auditing their supply chains for high-carbon activities, build internal capacity to address the impacts of climate change on their businesses and put internal prices on carbon to help reduce risks.

To be sure, this kind of transformation and innovation isn’t easy, but the United States has sparked technological revolutions before that have helped transform our economy—from automobiles to air travel to computer software, and doing so has required collaboration between industry and policymakers.

We are at a critical point in time—we can either accelerate our current path and invest in a clean energy future or succumb to rhetoric that forces us backwards. If we choose to electrify our economy, reduce our reliance on dirty fuels and become more energy efficient, we will not only be at the forefront of the next technological revolution, but we’ll also help lead the world in ensuring a better future for our planet.

Read more

The Future is California – How the State is Charting a Path Forward on Clean Energy

By Jayant Kairam

29812927675_a0c937acac_kThe late California historian Kevin Starr once wrote, “California had long since become one of the prisms through which the American people, for better and for worse, could glimpse their future.” These words have never felt truer. Just ask Gov. Jerry Brown or the leaders of the state legislature, who are all issuing various calls to action to protect and further the state’s leading climate and energy policies.

California is the sixth largest economy in the world and the most populous state in the nation. What’s more, we’ve shown that strong climate and energy policy is possible while building a dynamic economy. We’ve proved that clean energy creates far more jobs than fossil fuels – nationwide, more than 400,000, compared with 50,000 coal mining jobs – while protecting the natural world for all people.

It’s no shock our leaders are fired up. There’s too much at stake. With our state’s diverse, booming yet  unequal economy, we are not unlike the rest of the nation. State-level leadership is more important than ever, and other states can and should learn from California to drive action across the U.S.

A case study in a clean energy economy

Business and economic growth relies, in part, on certainty and a long-term view. That’s why electric fleet-firm Proterra announced it would manufacture its buses just outside Los Angeles – it understands its market is on the West Coast. Proterra is only the most recent of a long list of firms that understand California’s environmental policies provide market opportunities.

Silicon Valley titans like Google, Apple, and Facebook are all are well on their way to meeting internal commitments to 100 percent renewable energy. And California was recently ranked among the top five states for corporations that seek to buy or build renewable energy generation – attracting job-creating enterprises.

Importantly, clean energy is sparking businesses of all sizes. A new report highlights how the state’s long-standing energy efficiency requirements have helped create 300,000 jobs in energy efficiency – most coming from small firms.

What to watch in California

These are just a few examples of how forward-thinking policy – including the state’s 2030 climate targets and 50 percent renewable portfolio standard – are shaping markets, creating jobs, and stimulating economic growth. Citizens are demanding strong policy as clean energy technologies from LEDs, to smart thermostats, to rooftop solar continue to fall in costs.

Thus, California leadership is looking ahead to the clean energy frontier while also defending what we have. The three themes that guide where we are heading broadly center around effectively integrating cost-effective renewables, capitalizing on the potential of distributed energy resources, and making sure those advancements are accessible to all Californians. As more states make clean energy growth critical to economic and social progress, including the success of wind power in Texas, the recent bipartisan legislative victory in Illinois, and New York’s overhaul of their energy sector, it’s apparent that progress is catching on.

Integrating renewables to shape a clean, reliable grid

Although California is not new to enacting policies aimed at integrating renewables onto the grid, it remains paramount. Recent analysis suggests we are two years ahead of schedule in terms of hitting energy-load predictions associated with the amount and speed of California’s solar growth, illustrated by the infamous . This is, no doubt, a good problem to have. However, the growth  and cost competitiveness of renewables are making ever more pressing the challenge of meeting steep afternoon ramps in energy demand – when Californians come home and switch on their lights and appliances.

We are two years ahead of schedule in terms of hitting energy-load predictions associated with the amount and speed of solar growth.”

The state has worked to tackle renewables integration challenges from multiple fronts. Regulators passed rules to incentivize energy storage. Successful and smart design of time-of-use rates has the potential to shift energy load, and drive customers to consume electricity when it’s cheapest and cleanest. Additionally, the push to create a western-wide electric market is in large part due to the need to find new markets for California’s cheap, wasted solar, and to bring in cost-effective renewables from other western states when Californians need it most.

Moreover, a recent study by the California Independent System Operator (CAISO) showed that large-scale solar coupled with the right set of inverter technologies can transform renewables into grid resources that meet ramping and reliability needs. First and foremost, the key will be to extend our fantastic midday solar to serve energy demand throughout the day using clean energy strategies and incentives.

Optimizing distributed energy resources

California leads the nation in many indicators of distributed energy resources from the most advanced meters to solar installation. However, ensuring the positive impact of these clean resources reaches the grid is where the rubber hits the road. This will include mapping out and structuring markets so distributed energy resources, like  battery storage, can provide cost-effective power where it is most beneficial to help offset the need for future generation capacity.

Thankfully, bolstered by California’s leading clean tech industry, the state is already testing market reforms and demonstrations to prove the potential of these distributed resources. Here are a few examples:

  • This past summer, the three major utilities in the state contracted 82 MW in demand response from the Demand Response Auction Mechanism, a cutting-edge market vehicle for residential demand response.
  • Market reform is also happening through aggregation. The CAISO, which controls much of the state’s grid, received approval for a framework in which smaller distributed energy resources can meet reliability needs at the wholesale level when grouped together.
  • The Department of Defense is funding the largest “vehicle-to-grid” demonstration project in the world at the Los Angeles Air Force Base to test the potential of two-way power sources like electric vehicle batteries.  The aim is to determine whether the Defense Department’s fleet of electric vehicles can reliably provide power back to CAISO during times of peak demand.

As we look to further capitalize on the flexibility and affordability of distributed energy resources in forums like the major utilities’ long-term procurement planning processes, it will be critical to continue to push the tools that do the following: use methods like aggregation, use resources like two-way power, take location into account, and rethink the utility business model.

Ensuring success reaches all communities

California, through the SB 350 Barriers Study, is also examining how clean energy can spur growth in low-income and disadvantaged communities across the state. This signals that the state realizes that in order to achieve our energy goals we need to ensure clean energy resources are accessible to all communities. Despite big economic gains, the state continues to grapple with near 20 percent poverty. In both urban and rural regions there are high percentages of renters and seniors, who may not have the financial capital or live in physical environments suitable for investing in clean energy. These barriers make solutions like rooftop solar, high efficiency appliances, and household storage just out of reach.

The state has shown a good track record of protecting burdened communities from further environmental harm and incentivizing job-creating clean energy. However, the robust, far-ranging set of recommendations in the Barriers Study provides a source of inspiration and acknowledgement that we need to do more.

Our state is a multi-faceted economy, built on a diversity of people, politics, and industries, and defined by wealth,  poverty, and millions of hardworking Americans –  just like the rest of the country. We invite states in regions from the Pacific Northwest to the Mississippi Delta to learn from California’s success, and the challenges.

Read more

As Trump signals a rollback on environmental regulations, a new jobs report indicates that may not be such a good idea

By Liz Delaney

Jobs coverPresident Trump’s regulatory freeze that halted four rules designed to promote greater energy efficiency appears to be just the first salvo in an ongoing plan to roll back environmental protections and slash environmental budgets. While that is obviously foolish from an environmental perspective, it is also problematic from an economic/job creation standpoint.

As program director of EDF Climate Corps, I have daily insight into how businesses are accelerating the transition to a clean energy economy while hiring the next generation of talented, motivated leaders – which is a good thing, because they’re needed.

Our new report, Now Hiring: The Growth of America’s Clean Energy & Sustainability Jobs, underscores this trend. As the economy becomes more sustainable and energy efficient, a new market for clean energy and sustainability jobs is created. This market is large, growing and intrinsically local. Even better, these jobs span across economic sectors, including renewable energy, energy efficiency and other green goods and services, like local and state government, transportation and corporations.

The report revealed three key trends as sustainability jobs continue to grow across the country:

  1. Sustainability jobs represent a large and growing portion of the U.S. workforce across multiple sectors.

This isn’t a small, niche workforce. In fact, it’s outpacing the rest of the U.S. economy in growth and job creation. Solar employment opportunities alone are currently growing at a rate 12 times faster than the rest of the U.S. economy. And, they are generating more jobs per dollar invested–more than double the jobs created from investing in fossil fuels. Sustainability now collectively represents an estimated 4-4.5 million jobs in the U.S., spanning energy efficiency and renewable energy, to waste reduction and environmental education.

  1. Due to the on-site nature of many renewable and energy efficiency jobs, these jobs cannot be outsourced, and can pay above average wages.

 These aren’t just any jobs; they are well-paying, local opportunities that bolster our domestic economy. Most renewable and energy efficiency jobs can be found in small businesses, requiring on-site installation, maintenance and construction, making them local by nature. And, many pay higher than average wages. For example, energy efficiency jobs pay almost $5,000 above the national median, providing rewarding employment options to all Americans–even those without college or advanced degrees.


Keeping America great through a thriving clean energy and sustainability jobs market
Click To Tweet


  1. Clean energy and sustainability jobs are present in every state in America.

The entire country has benefitted from the boom in clean energy and sustainability jobs, which has employed workers in every state. Energy efficiency alone provides 2.2 million jobs, spreading out across the nation.

Continuing the Momentum

So how do we continue this momentum? Investments in clean energy and sustainability pay off in the long run and foster a stronger economy—that equals more jobs and a cleaner future. This is why businesses are increasing their investments in sustainability. A recent survey found that three quarters of firms now have dedicated sustainability budgets, and even more have hired additional sustainability staff. But that doesn’t surprise me. Corporate America understands that prosperity and a low-carbon economy go hand-in-hand, and should continue to support investment in this area.

Policy makers at the local, state and federal level must also recognize the positive economic impacts of this new job class and support the policies and programs that encourage growth and investment in renewable energy, energy efficiency, green transportation and more. Efforts to roll back or weaken environmental and energy policies will negatively impact current and future U.S. jobs, while slowing clean energy innovation.

If the question is how to help both the environment and the economy, we don’t have to search for the answer: it’s already here. America is transitioning to a clean energy future—we can’t afford to stand in its way.


Additional Reading:

Will the new President flunk the climate business test?

China is going all-in on clean energy while the U.S. waffles. How is that making America great again?


Follow Liz Delaney on Twitter, @lizdelaneylobo


Read more

New Study Improves Understanding of Natural Gas Vehicle Methane Emissions, But Supply Chain Emissions Loom Large

By EDF Blogs

natural-gas-truckBy Joe Rudek and Jason Mathers

Many commercial fleet operators have considered switching their fleet vehicles from diesel to natural gas to take advantage of the growing abundance of natural gas and reduced emissions. Natural gas trucks have the potential to reduce nitrogen oxides emissions (NOx) from freight trucks and buses.

Yet, adopting the emission reduction technologies and practices needed to curb the methane escaping during the production, transport and delivery of natural gas is critical to unlock the full environmental potential of these vehicles. Methane, the main component of natural gas, is a potent greenhouse gas released to the atmosphere at every step from production wells to the vehicle fuel tanks. Even small amounts of methane emitted across the natural gas supply chain can undermine the climate benefit of fuel-switching vehicles to natural gas for some period of time, as EDF research has shown.

A newly published scientific study, led by researchers with West Virginia University at the Center for Alternative Fuels, Engines and Emissions, measured methane emissions from heavy-duty natural gas-powered vehicles and refueling stations, and is greatly expanding what we know about emissions from natural gas-fueled vehicles. The study is the first project in EDF’s coordinated methane research series to analyze where and by how much methane emissions occur during natural gas end uses.

The WVU study found that emissions from the vehicle tailpipe and engine crankcase were the highest methane sources, representing roughly 30 and 39% (respectively) of total pump to wheels (PTW) emissions. Fortunately, engines with closed crankcases have recently been certified by EPA, avoiding the single largest source of methane emissions from these vehicles.

Fueling station methane emissions were reported to be relatively low, representing about 12% of total PTW emissions. WVU researchers based the fueling station emission estimates on the assumption that liquefied natural gas (LNG) stations have sufficient sales volume to effectively manage boil off gases, or the fuel lost as vapors when the LNG heats above its boiling point. Without alternative methods to manage boil off gas, low sales volume risks large methane releases.

Eleven industry groups participated in the WVU study – The American Gas Association, Chart, Clean Energy, Cummins, Cummins Westport, International Council on Clean Transportation, PepsiCo, Shell, Volvo Group, Waste Management, and Westport Innovations – and provided researchers with important insights. Their active involvement and determination to go where the science led them in reducing truck methane emissions greatly strengthened the study.

Measurements from the WVU study are helping to further our understanding of the climate impact of natural gas vehicles. This paper, along with other analyses, provides both industry and policymakers new insights to target technology improvements, and identify best practices for minimizing emissions. But pairing vehicle data with lifecycle emissions of methane across the entire supply chain remains essential to fully assess how natural gas trucks perform, from a climate perspective, relative to diesel trucks.

While only about 3 percent of heavy duty trucks run on natural gas today, some analysts suggest their market share could reach as high as 50 percent over the next two decades if high oil and diesel prices return. Meanwhile, investments in natural gas-powered utility vehicles and transit buses are growing, with 11 percent of such vehicles already running on natural gas.

As interest in natural gas vehicles grows, the time to get ahead of this methane supply chain leakage problem is now, before the industry hits a major growth spurt. Reducing methane leaks upstream of the vehicles themselves will be a key determinate in whether a shift in fuels will result in a positive or negative benefit for the climate.

Image source: Flickr/TruckPR

Read more