Enviroshop – About Magazine

California-Quebec carbon market participants appear to wait for future auctions and more information

By Erica Morehouse

California cap and trade, renewable energy

California’s Alta Wind Energy Center, Image Source: flickr

Carbon auction results released today show low demand for California’s carbon allowances in the first carbon auction of 2017, with only 18% of allowances selling.

The results say more about the many milestones that are ahead for the cap-and-trade program rather than anything about the cap-and-trade program’s core function of reducing overall emissions.

Results from the February 22 auction show:

  • The auction offered more than 65 million current vintage allowances (available for 2016 or later compliance) and sold about 11.6 million. Most of these allowances were utility-held allowances and some were from the province of Quebec. No ARB current allowances sold.
  • Almost 10 million future allowances were offered that will not be available for use until 2020 or later; a little over 600,000 of those allowances sold.
  • This means only about $8 million was raised for the Greenhouse Gas Reduction Fund.

Why cap and trade is working

Auction results themselves cannot tell us whether cap-and-trade is “working.” Though selling most allowances offered at stable prices at or above the minimum or floor price is generally a good sign, the reverse does not necessarily indicate that something went wrong with the cap-and-trade program itself. Disappointing auction result could simply be a product of the market’s expectation that more information on which to make an investment decision and plenty of allowances will be available in the future.

The best indicator is whether greenhouse gas emissions are declining.

The best indicator of whether California’s climate policies, including cap and trade, are working is whether greenhouse gas emissions are declining. As we reported in November’s auction blog, all indications suggest California’s policies are reducing emissions.

Another important factor is whether California’s economy continues to thrive as the state implements some of the most ambitious climate policies in the world. Recent data from the Bureau of Labor Statistics shows that in 2016, California continued to add jobs faster than the national average, as it has in every year that cap and trade has been in place.

So what explains current low demand

Outstanding litigation brought by the California Chamber of Commerce and others challenging California’s cap-and-trade program design is likely still hampering sales of allowances and negatively affecting the auction, as many participants may be waiting to see how the Court of Appeals rules on the legality of carbon market auctions. Oral Arguments were held in late January and a decision is likely by the end of April.

At the same time, Governor Brown in January asked the Legislature to extend the cap and trade program beyond 2020 with a two-thirds vote; the supermajority vote, also recommended by the independent Legislative Analyst’s Office, could insulate the cap-and-trade program from legal challenges like the one brought by the Chamber. Two bills currently in the Assembly – AB 378 (C. Garcia) and AB 151 (Burke) – could both facilitate the extension of cap and trade and be passed with a two-thirds vote. But we are still early in this process and the market is clearly still waiting to see how the Legislation plays out.

What we can understand from California’s February carbon auction

  • Regulated businesses under the cap-and-trade program will have to purchase a large portion of available allowances in order to comply with the cap-and-trade program requirements. It appears they have just decided to deploy the wait-and-see strategy they utilized in May and August, perhaps hoping for more information perhaps in advance of the next auction.
  • One thing that is different between this auction and the May auction that also saw similarly low demand, allowances prices on the secondary market were quite close to the current floor price of $13.57. This means that entities are still valuing carbon allowances close to the floor price, showing expectations of a steady market in the future, there just wasn’t quite enough demand to soak up all the supply in this auction.
  • The November auction when 88% of allowances sold was the last time participants were able to buy allowances for $12.73 at auction instead of the 2017 floor price of $13.57.  This opportunity for lower cost allowances seems to explain the higher demand in November.
  • Importantly, the ARB allowances that went unsold represent a temporary tightening of the cap. They will not be offered again until two auctions have fully sold all available current allowances. This is an important self-regulating design feature of the cap-and-trade program that helps stabilize prices in the face of inevitable market fluctuations in supply and demand.

What to expect from 2017 auctions

Two major developments this spring may provide more certainty about the post-2020 cap-and-trade program, which we’ve noted before could significantly increase auction demand. First, there will likely be a decision from the appeals court on the California Chamber of Commerce case. There could also be more clarity on the bill or package of bills that could move through the Legislature this year.

The core functions of the cap-and-trade program are operating as intended, reducing carbon emissions while the economy thrives.  But it remains to be seen whether the Legislature will be able to act to provide the highest level of certainty for the cap-and-trade market.

Read more

EPA’s Greenhouse Gas Inventory Makes Progress but Misses Forest for Trees

By David Lyon

In its draft 2017 GHG inventory, published this week, the EPA estimates methane emissions from the oil and gas industry were lower than their previous estimate in the 2016 inventory.

The vast majority of the decrease comes from methodological changes in how EPA does these estimates and does not represent actual reductions from improved industry practices. We expect to see fluctuation in EPA estimates in future inventories as the agency continues to revise their accounting methods; this inventory should be viewed as the final answer. But, to see the actual trend in emissions, you should compare 2015 emissions to their updated estimate of 2014 emissions, not the estimate from last year’s inventory. EPA estimates a mere 2% reduction in actual emissions, largely attributable to reduced drilling activity and well completions, which is a result of lower oil and gas prices in 2015. This points to the importance of recently enacted regulations, like the EPA NSPS and BLM rule, to drive the much greater reductions needed to minimize waste and the climate impacts of oil and gas.

What about super-emitters?

While the draft inventory represents progress in that EPA is continuing the process of incorporating new data such as the EPA Greenhouse Gas Reporting Program, much work remains to be done.  For example, the inventory still largely ignores “super-emitters,” which science has shown to be a major source of emissions. EPA has made an important step by including emissions from the Aliso Canyon blowout, but they exclude other transmission and storage super-emitters, which an EDF/CSU study found to account for almost a quarter of the T&S sector’s emissions. They also have started to account for production super-emitters by including estimates of emissions from stuck dump valves, but the underlying data for this source are flawed and likely greatly underestimate emissions. EPA’s current estimate of production super-emitters only account for 0.2% of production sector emissions.

In contrast, our recent paper in Nature Communications found that super-emitters account for one-third of well pad emissions in the Barnett Shale. Although the science supports some of EPA’s revisions that emissions from individual sources like processing plants have lower emissions than previously estimated, if they had fully accounted for super-emitters, those emissions would have more than offset the paper reductions reflected in the current draft. It is important to see the forest for the trees: emissions may be lower for some sources, but you’re not seeing the true magnitude of total emissions if you ignore the biggest emitters.

What’s next?

In order for EPA to continue their progress in updating the inventory, it is critical that they are allowed to rely on the best science without political interference. We must not be misled by interest groups who claim that the updated inventory is the final answer because it gives the false impression of a large emissions decrease. As a start, EPA should continue collecting data from the Greenhouse Gas Reporting Program and Information Collection Request, assure the data is publicly available, and make scientifically supported changes to the GHGRP to increase the accuracy of reported emissions. EPA should also review existing and forthcoming studies that evaluate the contribution of super-emitters and determine the best approach for fully incorporating super-emitters into the inventory.

EPA is accepting comments on the draft inventory until March 17 and plans to release a final inventory by April 15.

Read more

Lowering Desalination’s Energy Footprint: Lessons from Israel

By Kate Zerrenner

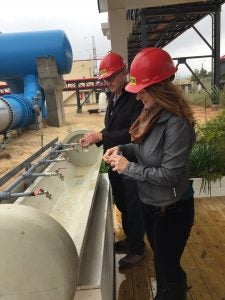
Kate Zerrenner and Leon Kaye of Triple Pundit tasting desalinated water at Sorek.

There’s an old expression that whisky is for drinking and water is for fighting over. The Legislative Session is upon us again in Texas, and count on water being an issue, as it always is in this drought and flood-prone state.

To start, this Session will see the approval of the 2017 State Water Plan (SWP), which is done in five-year cycles. In the five years since the last plan, Texas has gone from the throes of a devastating drought to historic flooding, which resulted in some reservoirs being full for the first time in 15 years.

Moreover, as more people move to Texas and climate change advances, there will be greater strain on the state’s water supplies. According to the SWP, Texas is already in a tighter situation than it was just five years ago: Surface water and groundwater availability will be 5 percent lower in 2060 compared to predictions in the 2012 plan, and existing water supplies are expected to drop by 11 percent between 2020 and 2070. Where are we supposed to get the water we need?

One place we could look to for ideas is Israel, which relies heavily on desalination – or the process of removing salt from water – to meet its needs. During Session, there will likely be calls to implement and fund desalination projects in Texas, which can help ensure water supplies in the future. But we need to take a page from Israel’s book, and create plans and policies that are thoughtful about reducing the technology’s energy footprint.

Cutting desal costs in Israel

Sixty percent of Israel is desert, and the rest is semiarid. (Texas, in comparison, is about 10 percent desert.) The harsh, dry climate means ensuring water supplies is a top priority, and as a result Israel gets up to 75 percent of its potable water from desalination. To put that into perspective, the entire state of Texas currently produces about 123 million gallons per day with desalination, or roughly 465,606 cubic meters per day. The Sorek Desalination Plant outside Tel Aviv, one of many in the country, alone produces about 624,000 cubic meters per day/ 164 MGD.


Lowering Desalination’s Energy Footprint: Lessons from Israel
Click To Tweet


I recently toured the Sorek plant, the largest desal plant in the world, which provides about 20 percent of Israel’s potable water. One of the things that struck me, other than the sheer size, was how energy was a front-and-center concern. Since desal plants need constant power – and a lot of it – energy is by far the most expensive part of running the plant. Groundwater desal is highly energy-intensive, and seawater even more so – power is estimated at about half of seawater desal plants’ entire operating costs.

Kate Zerrenner and Leon Kaye of Triple Pundit standing in a desalination pipe at Sorek.

Three tactics help ease these costs and maintain plant reliability:

  • On-site power generation: Two of the other biggest plants in Israel are located next to power plants, which means less energy lost during transmission and distribution, as well as greater reliability. One of those, Hadera, is located near a gas-fired power plant, which requires significantly less water than coal. Israel could further cut desal’s water footprint by installing no-water resources like wind turbines or solar panels on-site, as Texas is trying to do.
  • Energy efficiency: Israel is home to the two most energy-efficient desal facilities in the world: Hadera and Sorek, respectively. Sorek looks to reduce its energy consumption at every step of the process, like its energy recovery system, which captures energy from the brine stream that would have otherwise been wasted and uses it to power pumps. Unfortunately, U.S. desal plants tend to be behind the tech curve because the approval process takes so long. With a robust, more streamlined approvals process and newer technology, American plants could maximize efficiency as Israel does.
  • Taking advantage of smart pricing: Israel has variable electricity rates, meaning they change depending on the season, day of the week, and time of day. Sorek negotiated a lower electricity rate in exchange for participating in the demand response program – in this case, agreeing to do the most production at night when both electric demand and prices are lower. In fact, Sorek was built to be responsive to peak demand: It can change its operating capacity from 30 to 120-percent production in less than five minutes, in response to the electricity rate. Moreover, by enabling customers to alter their energy-use based on peak demand and pricing, Israel’s entire electric grid benefits from greater stability. Leveraging demand response could help desalination in Texas and other states that deal with drought, like California, be more energy- and water-efficient.

Desal in Texas

So, what does all this mean for Texas? In his recent book, Let There Be Water, Seth M. Siegel writes about how native Texan Lyndon B. Johnson shared former Israeli Prime Minister David Ben-Gurion’s approach to water. Ben-Gurion saw the promise of desal and LBJ seemed to view the technology as the future for ensuring America’s water supplies, especially in dry areas like his own beloved Texas Hill Country. Today, Texas is home to the largest inland desal facility in the world, the Kay Bailey Hutchison Desalination Plant

“Desalination is turning the water issue from a zero-sum game to a win-win.”

LBJ may have been the first Texas proponent of desal, but he certainly is not the last. IDE, the company behind Sorek (and the new Carlsbad facility in San Diego), opened an office in Austin a few years ago to look for potential sites in the state. Further, Governor Greg Abbott, recently paid a visit to Sorek, and many legislators who understand the importance of safeguarding water supplies are supportive of desal.

In the SWP 2017, about 2.7 percent of the proposed supply strategies are for desalination. That’s a relatively small percentage, but it translates to a giant energy footprint. When it comes to desal, Texas leaders need to understand that using low-water energy sources like solar and wind is important, energy efficiency is critical, and having smart energy policy that supports a more flexible grid – like Israel’s variable pricing – rounds it out.

As Texas embarks on another round of figuring out how to solve our water woes, we could take a lesson from Israel. The country has figured out how to maximize desalination’s potential, while minimizing its energy footprint. As Uri Ginott of EcoPeace Middle East said, “Desalination is turning the water issue from a zero-sum game to a win-win. Every drop doesn’t have to come at the expense of another.” When we live in a typically dry place that’s only expected to get drier, being comprehensive about our water solutions sets us all up to win.

Editor’s note: Kate was a guest of Vibe Israel, a non-profit organization leading a tour called Vibe Eco Impact in December 2016, which explores sustainability initiatives in Israel.

Read more

EPA Has the Responsibility and the Tools to Address Climate Pollution Under the Clean Air Act

By Tomas Carbonell

(EDF Attorney Ben Levitan co-authored this post)

It’s barely a week since Scott Pruitt was confirmed as EPA Administrator, and he has already provided yet another indication of why he has no business leading the agency.

In an interview with The Wall Street Journal, Pruitt says he wants to undertake a “careful review” as to whether EPA has the “tools” to address climate change under the Clean Air Act. Pruitt further states that EPA should withdraw the Clean Power Plan – a vital climate and public health measure to reduce carbon pollution from the nation’s power plants – and instead wait for Congress to act on the issue of climate change.

Those statements are contrary to the law and disconnected from reality. As Pruitt surely knows, the federal courts – including three separate decisions of the Supreme Court – have made it abundantly clear that the Clean Air Act requires EPA to protect the public from dangerous pollutants that are disrupting our climate. The courts have repeatedly rejected Pruitt’s theory that climate pollution is an issue that only Congress can address through new legislation.

Over the last eight years, EPA has demonstrated that the Clean Air Act is an effective tool for addressing the threat of climate change — by putting in place common sense, highly cost-effective measures to reduce climate pollution from cars and trucks, power plants, oil and gas facilities, and other sources. These actions under the Clean Air Act are saving lives, strengthening the American economy, and yielding healthier air and a safer climate for our children.

Pruitt’s casual willingness to abandon that progress based on a discredited legal theory demonstrates deep contempt for the laws he is charged with administering and the mission of the agency he now leads.

EPA Is Legally Obligated to Address Climate Pollution

The Supreme Court has repeatedly held that EPA clearly has the authority and responsibility to address climate pollution under the Clean Air Act:

  • In Massachusetts v. EPA (549 U.S. 497, 2007), the Supreme Court held that climate pollutants plainly fall within the broad definition of “air pollutants” covered by the Clean Air Act. The Court ordered EPA to make a science-based determination as to whether those pollutants endanger public health and welfare (a determination that EPA ultimately made in 2009, and that has been upheld by the federal courts).
  • In American Electric Power v. Connecticut (564 U.S. 410, 2011), the Supreme Court held that the Clean Air Act “speaks directly” to the problem of climate pollution from power plants.
  • In Utility Air Regulatory Group v. EPA (134 S. Ct. 2427, 2014), the Supreme Court held that the Clean Air Act obligated EPA to address climate pollution from new and modified industrial facilities.

In Massachusetts v. EPA, the Bush Administration’s EPA made — and the Supreme Court rejected —Pruitt’s same argument that EPA lacks the authority and tools to address climate pollution.

The Supreme Court said in no uncertain terms that:

The statutory text forecloses EPA’s reading … Because greenhouse gases fit well within the Clean Air Act’s capacious definition of ‘air pollutant,’ we hold that EPA has the statutory authority to regulate the emission of such gases from new motor vehicles. (emphasis added)

The Supreme Court went on to explain that – contrary to what Pruitt is now saying – Congress intended to provide EPA with the tools it needed to address new air pollution challenges, including climate change:

While the Congresses that drafted [the Clean Air Act] might not have appreciated the possibility that burning fossil fuels could lead to global warming, they did understand that without regulatory flexibility, changing circumstances and scientific developments would soon render the Clean Air Act obsolete. The broad language [of the Act] reflects an intentional effort to confer the flexibility necessary to forestall such obsolescence. (emphasis added)

The Court also found that nothing about climate pollution distinguishes it from other forms of air pollution long regulated under the Clean Air Act. It rejected the Bush Administration’s attempt to argue that climate pollution is somehow “different,” saying that theory was a “plainly unreasonable” reading of the Clean Air Act and “finds no support in the text of the statute.”

That was the law under the Bush Administration – and it remains the law today. It is a binding, rock-solid precedent regardless of who is running EPA at any given time.

Pruitt ought to know all this, because he was one of the Attorneys General who joined polluters and their allies in challenging EPA’s determination that climate pollution endangers public health and welfare.

That 2009 determination was in response to Massachusetts v. EPA, and it was based on an immense body of authoritative scientific literature as well as consideration of more than 380,000 public comments. Yet in their legal challenge to the determination, Pruitt and his allies again argued that EPA should have declined to make an endangerment finding based on the supposed difficulty of regulating climate pollution under the Clean Air Act.

A unanimous panel of the D.C. Circuit rejected those claims, finding that:

These contentions are foreclosed by the language of the statute and the Supreme Court’s decision in Massachusetts v. EPA … the additional exercises [state and industry challengers] would have EPA undertake … do not inform the ‘scientific judgment’ that [the Clean Air Act] requires of EPA … the Supreme Court has already held that EPA indeed wields the authority to regulate greenhouse gases under the CAA. (Coalition for Responsible Regulation v. EPA, 684 F.3d 102, D.C. Cir. 2012, emphasis added)

The Supreme Court did not even regard further challenges to the endangerment finding as worthy of its review. (See Order Denying Certiorari, Sub Nom Virginia v. EPA, 134 S.Ct. 418, 2013)

Pruitt’s suggestion that EPA should stop applying the Clean Air Act’s protections to an important category of pollutants – greenhouse gases – amounts to a repeal of Congress’s core judgment that all air pollutants that cause hazards to human health and the environment need to be addressed under the Clean Air Act. It is an audacious and aggressive effort to alter the Clean Air Act in a way that Congress has never done (and has specifically declined to do when such weakening amendments have been proposed).

EPA Has Established a Strong Record of Successful Climate Protections

Pruitt’s statements also ignore the pragmatic way in which EPA has carried out its legal obligations to address climate pollution. Since Massachusetts v. EPA was decided, EPA has issued common sense, cost-effective measures for major sources of climate pollution – including power plants; cars and trucks; the oil and gas sector; and municipal solid waste landfills.

These actions demonstrate that Pruitt is flatly wrong to suggest that EPA lacks the “tools” to address climate change under the Clean Air Act. They include:

  • The Clean Power Plan will reduce carbon pollution from the nation’s power plants to 32 percent below 2005 levels by 2030, while providing states and power companies with the flexibility to meet their targets through highly cost-effective measures – including shifting to cleaner sources of generation and using consumer-friendly energy efficiency programs that would reduce average household electricity bills by $85 per year. The Clean Power Plan will protect public health too, resulting in 90,000 fewer childhood asthma attacks, 300,000 fewer missed school and work days, and 3,600 fewer premature deaths every year by 2030. The value of these health benefits alone exceeds the costs by a factor of four, and the climate benefits are roughly as large.
  • EPA’s standards for cars and other light-duty vehicles, will save the average American family $8,000 over the lifetime of a new vehicle through reduced fuel costs – while saving 12 billion barrels of oil and avoiding 6 billion metric tons of carbon pollution. A recent analysis by EPA and the U.S. Department of Transportation found that manufacturers are reaching these standards ahead of schedule and at a lower cost than originally anticipated.
  • The most recent Clean Truck Standards, which were finalized in August 2016, will save truck owners a total of $170 billion in lower fuel costs, ultimately resulting in $400 in annual household savings by 2035 – while also reducing carbon pollution by 1.1 billion tons over the life of the program. These benefits are one reason why the Clean Truck Standards have broad support from manufacturers, truck operators, fleet owners and shippers.
  • EPA’s methane emission standards for new and modified oil and gas facilities, finalized in June 2016, will generate climate benefits equivalent to taking 8.5 million vehicles off the nation’s roads – while having minimal impact on industry.

When Scott Pruitt suggests that the Clean Air Act is a poor fit for regulating climate pollution, he overlooks the clear command of the statute, as confirmed repeatedly by the Supreme Court. He also ignores EPA’s successful history of issuing regulations that protect the environment while promoting significant health and economic benefits.

Pruitt might try to distort the truth in an effort to wipe climate protections off the books — subjecting our children and grandchildren to the dire health, security and economic effects of unlimited climate pollution in the process. But the law and the facts are not on his side.

EPA must address climate pollution under the Clean Air Act, and it has the tools to do so effectively.

Read more

Trump Promises a Renaissance for Coal – But These Clean Energy Numbers Tell a Different Story

By Jim Marston

A big part of President Trump’s agenda involves rolling back critical environmental protections. And yet, the issue that most people think won him the 2016 election is the economy.

From coast to coast – and especially places in between – jobs were the most pressing concern for American voters. So Trump has promised he will create 25 million new ones over the next decade by, among other things, reviving America’s declining coal industry.
“We’re gonna put the miners back to work,” he told a roaring crowd in West Virginia last year.

But for all the bluster about bringing coal production back to life, Trump is not just ignoring market realities – he’s also overlooking the biggest economic opportunity since the computer revolution.

Here are the good energy jobs

In total, 2.7 million people [PDF] now work in clean energy nationwide, manufacturing and installing solar panels, auditing energy efficiency, developing smart energy apps, building windmills and on and on.

The remarkable growth of the solar and wind industries is already well-documented: Today, nearly 102,000 Americans work in wind and more than 260,000 in solar. Together, that’s more than three times the number of people who work in coal.


Trump promises a renaissance for coal – but these clean energy numbers tell a different story
Click To Tweet


Less known, but equally important, is the rapidly emerging energy efficiency sector – now employing 2.2 million – as well as the advanced vehicle industry, which today employs 174,000 people. All this points to a changing energy economy.

And yet, on the campaign trail and since he was sworn in, Trump has consistently favored coal over clean energy, claiming that excessive regulation is what’s been holding back coal.

The real story behind coal’s trouble

Boosting coal jobs by eliminating the most basic pollution protections may be a popular talking point in some places, but that plan is not supported by reality.

The truth is, coal has had a hard time competing on price for many years now. The American natural gas boom with its lower prices, along with a constant price drop for renewable energy sources such as wind and solar, have put significant pressure on coal.

 The president is hitching his economic wagon to a dying star.

Result: American coal has been in decline for decades, and nothing the Trump administration can say or do will reverse that long-term trend. The president is hitching his economic wagon to a dying star – and ironically, he’s likely to encourage even more natural gas production, which will add price pressure on coal.

His promises about “clean coal” are equally hollow.

Maybe, someday, we will be able to burn coal without spewing poison into local communities and millions of pounds of carbon dioxide into the atmosphere. We encourage scientists to keep trying; perhaps they’ll figure out an affordable solution.

But today, there’s no such thing as clean coal – at least as it relates to carbon pollution – no matter what the Trump administration says. It’s a marketing ploy and a distant pipe dream, like low-calorie ice cream or fat-free cheeseburgers.

So what does all this mean?

Time for Trump to come clean

Eventually, the president is going to have to explain to unemployed coal miners in West Virginia, Kentucky and Pennsylvania – who are suffering real economic pain – why he didn’t put them back to work. Or why he didn’t help them get retrained for jobs that will carry them through the next 30 years.

Community colleges, chambers of commerce and small businesses nationwide are chomping at the bit to retrain workers to make, install and maintain our 21st century energy system. Federal support for that approach would deliver far more jobs than empty rhetoric about reviving coal.

In other words, if he truly wants to get struggling coal workers back in business, Trump should look to the industry of the future, rather than the past. His voters will reward him if he does.

The post originally appeared on our EDF Voices blog.

Read more

What the US Electricity Sector Can Learn from the Telecom Revolution

By Diane Munns

Utilities and regulators are not typically known for innovation. Instead, they tend to focus their efforts and attention on reliability and cost effectiveness. So, when Rob Powelson, new president of the National Association of Regulatory Utility Commissioners (NARUC) kicked off his first national meeting under the theme “Infrastructure, Innovation and Investment,” I was intrigued.

The opening general session focused on how to upgrade aging utility infrastructure in ways that optimize new technology, and introduced a new Presidential Task Force on Innovation to promote modernization. This task force will discover how NARUC members can embrace emerging innovation – like integrated energy networks and battery storage.

This utility-industry focus on innovation marks a new direction. To prepare for the venture, we can learn from the most recent rapid disruption in a related industry, telecommunications: a mere 20-year transition from POTS (plain old telephone service) to PANS (pretty amazing new stuff). This cautionary tale reveals that the winners are grid operators who welcome new ideas and offer customers new services.

A cautionary tale            

In 1996, Congress opened up the local telecommunications market to competition, to spur lower prices and innovation. At the time, the market was dominated by the monopoly Bell System, affectionately known as Ma Bell, and its regional operating companies (also known as “the Bells”). There had been little innovation in local service offerings beyond the color and shape of the princess phone and some services, like call forwarding and call waiting. In fact, the Bells had argued to regulators for a long time that it would compromise the reliability of the system to allow others to connect.


What the US Electricity Sector Can Learn from the Telecom Revolution
Click To Tweet


The opening of the market coincided with dramatic technological advancementss in communications, wireless, and internet. The Bell companies were extremely resistant to new market entrants and played regulatory games with everything from interconnection to customer service. State commissions were flooded with complaints of anti-competitive behavior, and the Bells used the regulatory process to block competition and customer access. While those wars waged, customers migrated from the telephone company to mobile wireless and the internet.

The once dominant Bell System is gone, and the existing wireline network struggles as it continues to lose market share. In contrast, the new networks, mobile and broadband, have thrived as they offer customers choice and evolving new services. We know that wireline phones were simply supplanted by seemingly superior, more desirable technologies. What we don’t know is how much the Bells’ emphasis on fighting change in regulatory battles, rather than putting resources into innovating within their networks and working with new entrants, contributed to their demise.

A new era 

The American telecommunications story of grid defection and bypass can enlighten today’s utilities.

The accelerating transition of the electricity system has been compared to the journey taken in the telecommunications industry. While the experience is not completely analogous, there are lessons to be learned. For example, customers flocked to wireless cell phones that offered them new services and mobility. The internet, designed to allow innovation at the edges, made it easy for innovators to interconnect their applications to the internet and reach customers. The more people that connect and use the networks, the more valuable the service. These technologies converged, giving customers the ubiquitous communications and internet devices we carry today, and increasingly more people have cut the cord to the telephone company.

Broadband internet, along with wireless technology, have transformed how we think about communications. The tale of the powerful Bell operating companies, in light of these new alternative networks, deserves study. Some thought alternative platforms couldn’t be developed to compete with the telephone company, and were proven wrong.

The American telecommunications story of grid defection and bypass can enlighten today’s utility system operators and regulators as they stand at the crossroads of choosing between using regulatory processes to cling to the past, or innovating in tandem with new technologies and new companies to deliver value to customers. In addition to delivering new value and markets, the new ways are cheaper and cleaner, too.

Read more

REPORT: CA Utilities Are Leaking Lots of Gas – but There’s a Way to Stop It

By Amanda Johnson

A new report confirms with greater accuracy than ever before that California natural gas utilities are letting huge amounts of their product escape into the atmosphere – about 6.6 billion cubic feet in 2015. That’s more than the amount of gas released during last year’s Aliso Canyon disaster, and over twice the total loss from all of the state’s oil and gas wells.

These huge gas losses are a major environmental problem. Methane – the main ingredient in natural gas – is a potent climate pollutant.  Leaks and other emissions from California utilities in 2015 have the same climate impact as burning more than 1 billion gallons of gasoline.

Where the data comes from and what it means

In 2014 California passed SB 1371, a new law requiring utilities to reduce methane emissions. This new report is based on emissions data collected under that law. 

The report estimates that about 78% of gas leaks occur at four kinds of sources: Customer meter sets; metering and regulating stations; ungraded leaks; and intentional venting.

This data also allows the state to track progress against newly-legislated methane reduction goals like the one included in SB 1383 which sets a target of 40% emissions reductions below 2013 levels.

Changing the way we pay for gas

While the accuracy of the data is better than ever before, the estimates are still conservative because they are based on emissions factors and leak estimates, rather than direct measurements. And the emissions are likely to go up before they go down. That’s because leak detection and quantification technology required under SB 1371 is better equipped at finding leaks – meaning utilities will start accounting for more leaks with each survey.

Based on an average wholesale market price of gas, these loses mean ratepayers are paying approximately $18 million every year for gas that is never delivered.

The issue of what to do about the value of lost gas – and the resulting incentives for additional leak reduction – will be an important conversation. SB 1371 asks the Commission to adjust the amount that utilities can charge customers based on actual leakage volumes, meaning the companies may no longer get paid for gas that leaks from their pipes before it’s delivered to the customer.

Two utilities, two different strategies for reducing gas leaks

While the report reveals troublingly high emissions we also know that California’s two largest gas utilities, PG&E and SoCalGas, are committing to new efforts to reduce methane pollution. Their public filings, however, point to markedly different strategies.

PG&E has already begun implementing most of the practices proposed by CPUC as part of SB 1371. These include modern mobile leak detection equipment, faster leak survey, and a reorganized leak repair processes to bundle and fix leaks faster and more efficiently.

In contrast, SoCalGas – the nation’s largest gas utility, and the company responsible for the Aliso Canyon gas leak – appears to be dragging its feet. The utility argues against the practices recommended by CPUC and embraced by PG&E and other leading utilities, arguing that they are ineffective at finding and helping reduce lost gas.

These differences in utility commitment to reducing emissions may be softened by providing the public with an accurate and transparent report of emissions. Utilities will be more inclined to ensure their actions actually reduce emissions if they are held accountable by the public.

How better transparency can improve emissions reductions efforts

SB 1371 requires the Commission to provide the public with accurate information about the number and severity of gas leaks. The report aggregated the data of all the utilities and storage facilities but did not specify utility-specific statistics. The companies posted some of the data publicly on their websites only after requests by EDF, even though public transparency is required under the law.

Obscuring the origin of emissions is inconsistent with other air pollution and climate change reporting requirements at California Air Resource Board or the EPA. Air pollution data is public, and California ratepayers have a right to see a transparent evaluation of their utilities emissions profile. In the future, the CPUC should show total emissions for individual utilities more clearly, including labeling their share of leaks and emissions in each category.

Only by portraying emissions from individual utilities, instead of industry-wide aggregated data, will transparency requirements be satisfied. Public accountability will also help to ensure utilities stay motivated and continue to reduce their emissions. The Commission should not shy away from showing ratepayers which utilities are achieving the most gains. Not only will these steps give the public and utility ratepayers transparent analysis, it will ensure the utilities know which emissions to prioritize.

Image source: Max Pixel

Read more

EDF’s assessment of a health-based benchmark for lead in drinking water

By Tom Neltner

Tom Neltner, J.D.is Chemicals Policy Director

Health professionals periodically ask me how they should advise parents who ask about what constitutes a dangerous level of lead in drinking water. They want a number similar to the one developed by the Environmental Protection Agency (EPA) for lead in dust and soil (which is the primary source of elevated blood lead levels in young children). I usually remind them that EPA’s 15 parts per billion (ppb) Lead Action Level is based on the effectiveness of treating water to reduce corrosion and the leaching of lead from plumbing; it has no relation to health. Then I tell them that EPA is working on one and to hold tight. Admittedly, that is not very satisfying to someone who must answer a parent’s questions about the results of water tests today.

On January 12, EPA released a draft report for public comment and external peer review that provides scientific models that the agency may use to develop potential health-based benchmarks for lead in drinking water. In a blog last month, I explained the various approaches and options for benchmarks that ranged from 3 to 56 ppb. In another blog, I described how EPA’s analysis provides insight into the amounts of lead in food, water, air, dust and soil to which infants and toddlers may be exposed. In this blog, I provide our assessment of numbers that health professionals could use to answer a parent’s questions. Because the numbers are only a start, I also suggest how health professionals can use the health-based benchmarks to help parents take action when water tests exceed those levels.

EDF’s read on an appropriate health-based benchmark for individual action on lead in drinking water

When it comes to children’s brain development, EDF is cautious. So we drew from the agency’s estimates calculated by its model to result in a 1% increase in the probability of a child having a blood lead level (BLL) of 3.5 micrograms of lead per deciliter of blood (µg/dL).

EDF’s assessment of a health-based benchmark for individual action on lead in drinking water
Age of child in home and type of exposure Houses built before 1950¹ Houses built 1950 to 1978² Tests show no lead in dust or soil³
Formula-fed infant 3.8 ppb 8.2 ppb 11.3 ppb
Other children 7 years or younger 5.9 ppb 12.9 ppb 27.3 ppb

As you consider the appropriate number, keep the following in mind:

  • There is no safe level of exposure to lead in children’s blood. The public health goal is always 0 ppb but it is difficult to translate into action on an individual home. The health-based benchmarks are designed to help public health professionals provide practical advice to parents.
  • Since a health professional is typically focused on actions an individual should take, we selected a number representing a child having a less than 1% chance of having an elevated BLL.
  • We used 3.5 µg/dL instead of the Reference Value of 5.0 µg/dL established by the Centers for Disease Control and Prevention (CDC) in 2012 because CDC is expected to lower the level to 3.5 µg/dL later this year. This CDC Reference Value is referred to by EPA as the elevated BLL.
  • The levels are for the amount of lead in drinking water actually consumed. Water test results can vary based on a number of factors, including the sampling method. If a resident conducted the water test for a utility to ensure compliance with the Lead and Copper Rule, the sample was the first liter of water coming from the cold water tap at the kitchen sink after it sat in the faucet overnight. This sample most likely overestimates the exposure. However, if the home has a lead service line (LSL) or lead pipes in internal plumbing, actual exposure may be more or less than the level found in the first liter depending on the condition of the pipe. Finally, lead levels change with the seasons and water chemistry; a single test will miss these changes.
  • The numbers come from a draft report. EPA is seeking public comment and convening an expert peer review panel to provide guidance. When it issues proposed revisions to the Lead and Copper Rule, hopefully by the end of 2017, the numbers may very well change.
  • One of the reasons the health-based benchmarks for children between 1 and 7 years old are much higher than those for formula-fed infants is that they drink much less – less than half – the amount of tap water.

EDF’s suggestions for how health professionals can use the health-based benchmark

If the water tests are above the appropriate health-based benchmark, we suggest health professionals take the following steps.

Step 1: Always consider paint. Lead-based paint remains the primary source of lead exposure to children with elevated BLLs. Low income and minority children remain at the greatest risk. When the paint is disturbed or deteriorated, it may contaminate soil and dust that a child can ingest. If the home is built before 1978, educate the resident on the hazards and suggest testing the soil, floors and window sill. Provide them EPA’s Protect Your Family from Lead in Your Home pamphlet. It is far from perfect, but it is useful.

Step 2: Determine whether the home has an LSL. Call the drinking water utility to see if they know or check their website as more and more communities are making the information available on-line. When you are in the home, if you can, check the water line as it comes into the house. National Public Radio has a good demonstration of how to do this check. If you have a portable X-ray fluorescent (XRF) lead paint analyzer, you can use it instead of scratching the pipe. If the home has or may have an LSL, advise the resident to work with the utility to have it safely removed since it can unpredictably release high levels of lead that may be missed by a one-time water test. Some communities are offering innovative ways to help offset the replacement costs. Until the LSL is replaced, suggest the resident periodically test the water and consider a filter to remove lead in the drinking water, especially if young children, pregnant women, or a formula-fed infant lives there. Flushing is a lower cost alternative, but may take several minutes to clear the water that has been sitting in the LSL. If there is no LSL, only a few seconds of flushing may be needed.

Step 3: Understand the sample method and results. Testing is typically performed on water samples taken from the first liter coming from the cold water tap at the kitchen sink after it sat in the faucet overnight. This method is how utilities evaluate compliance with EPA rules and, unless there is an LSL, may overestimate typical lead levels in the water. Consider taking another sample after flushing the line and letting it sit for 30 minutes. It should have non-detectable levels of lead and demonstrate the benefits of flushing before use. You may also want to test the water from the bathroom where children may get their water during the night.

Step 4: Provide basic educational materials to help residents reduce lead in their drinking water. The National Drinking Water Alliance has useful materials on its website including excellent fact sheets for renters and condo owners and for homeowners.

Conclusion

Testing water can help residents better understand how much lead may be in the water they drink. The results are most useful when compared to a health-based benchmark that is relevant to the resident’s situation. Health professionals can help individuals understand the health risks associated with the lead levels, and provide useful suggestions for them to take appropriate steps to reduce their exposures and be more confident that the water they and their children drink is safe.


¹ For homes without lead in dust or soil, we used Exhibit 22 with a lead in soil and dust of 0 µg/g.

² For pre-1950 homes, we used EPA’s Exhibit 50, which is based on the geometric mean of lead in soil of 221 µg/g (Exhibit 7) and dust of 134 µg/g (Exhibit 8).

³ For homes built after 1950, we used Exhibit 22 with a lead in soil of 37 µg/g and dust of 72 µg/g. This is similar to the levels reported by EPA for housing built after 1950 of 23 µg/g and dust of 63.7 µg/g.

Read more

Saving Energy and Doubling Worldwide Water Supplies – One Drip at a Time

By Kate Zerrenner

Netafim HQOn a warm December day, I stood in a jojoba field in the Negev Desert in southern Israel and watched water slowly seep up from the ground around the trees. First a tiny spot, then spreading, watering the plants from deep below. This highly efficient system is known as drip irrigation, and I was there to meet with the world’s leading drip irrigation company, Israel-based Netafim.

Naty Barak, the Netafim director who I met on the visit, notes that if the world’s farmers increased their use of drip irrigation to 15 percent (up from just under 5 percent now), the amount of water available for use worldwide could double.

Drip irrigation saves more than water. Whereas traditional irrigation typically uses quite a bit of energy, drip reduces the pressure (and power) needed to get the water to the crops while reducing the need for energy-hungry fertilizers. Plus, due to the inextricable link between water and power, saving water results in further saved energy.

Texas has already enhanced its water efficiency, but it could go further and take a page out of Israel’s book. By investing in thoughtful drip irrigation now, Texas could lead the nation on expanding this innovative technology and significantly reduce the energy footprint of its irrigation sector, while protecting water supplies for our growing cities and creating more sustainable farming practices.

Lead image: Netafim headquarters. Above: Listening to Naty Barak and the farmer who works the jojoba field.

Lead image: Netafim headquarters. Above: Listening to Naty Barak and the farmer who works the jojoba field.

Opportunity for enhanced efficiency

First, a little context. In the US, about 33 percent of our water is used for irrigation (compare that with 45 percent for thermoelectric power). Texas ranks second in the country, after California, for agricultural products and has more than 10 percent of the irrigated acres in the US, with about 57 percent of water used in Texas for irrigation. Due to efficiency and technology advancements in the irrigation sector, that amount of water use has remained about the same since the 1970s, despite increases in crop yield.

Yet nearly all of Texas still relies on technologies that use more water than necessary, such as sprinklers, flood, and furrow irrigation. Only about 3 percent of Texas fields are irrigated with drip irrigation. In comparison, 75 percent of Israel’s crops are irrigated by drip – a huge increase over Texas, and even over California’s 30 to 40 percent.

Clearly, the Lone Star State and the rest of the country have the potential to significantly increase the use of this energy- and water-efficient technology. And further technological advancements are in the works, with Texas at the forefront. In 2015, James Bordovsky, one of the senior scientists at Texas A&M AgriLife Research, received an international award from Netafim for his decades of practical research into increasing water efficiency in the cotton production areas of the High Plains region of West Texas.

Protecting food supplies

If deployed thoughtfully, drip technologies could help ensure the sustainability of farmers in the state and other dry areas.


Saving Energy and Doubling Worldwide Water Supplies – One Drip at a Time
Click To Tweet


For example, a potential game changer is the use of drip irrigation in rice cultivation. Netafim has introduced drip systems in India, Taiwan, and other countries that produce rice. By switching from traditional flood irrigation, these farmers can expect both water and power savings of 60 to 70 percent. In Central Texas, rice farmers weren’t given their water allotments for four years during the most recent drought because their rights were junior to others, such as cities. With drip technology, they would be able to farm with less water and drought conditions wouldn’t present as big of a threat.

Additionally, during both Texas and Israel summers, the hot, dry conditions mean crops may need additional water. At the same time, increases in electric demand for air conditioning adds pressure to already stressed and thirsty grids. Lowering irrigation’s water and energy demand can help ensure crops get the water they need, and people have the power they need.

Growing demands

Drip irrigation worldwide could help us meet our food, water, and energy demands for a growing population. For example, the Dallas, Austin, and Lower Rio Grande Valley areas of the state are expected to increase municipal water demand by 90 percent by 2060, due to population growth. Texas needs to ensure that water supplies are available for all its needs, and increasing efficiency in the agricultural sector can help us meet cities’ demands, too.

Increasing water and energy efficiency in the agricultural sector can help meet Texas’ needs.

It should be noted that sometimes drip irrigation actually increases the total amount of water a crop uses. This is because the technology improves how well a crop can grow, thus increasing crop productivity and water use. That said, thoughtful use of drip irrigation can be highly valuable.

Netafim has created an oasis in the Israeli desert, a powerful image compared to pictures of a barren, extra-terrestrial landscape that existed before drip irrigation. To ensure the sustainability of Texas farmers, an easy step for state policymakers would be to support – financially and practically – incentives and efforts to help farmers take advantage of this water- and energy-saving process. Support could come in the form of teaching the technology’s benefits, especially to smaller farms, technical training, and financing for the initial purchase of drip irrigation equipment. Doing so can protect our food, water, and energy supplies. In a changing climate, a vision of an oasis in the desert is a comforting thought.

Editor’s note: Kate was a guest of Vibe Israel, a non-profit organization leading a tour called Vibe Eco Impact in December 2016, which explores sustainability initiatives in Israel.

Photo source: Shani Sadicario

This post originally appeared on our Energy Exchange blog

Read more

A Toxic Scavenger Hunt: Finding the First 10 Lautenberg Act Chemicals

By Jack Pratt

Jack Pratt is Chemicals Campaign Director

Recently, EPA identified the first 10 chemicals for evaluation under our country’s newly reformed chemical safety law. That motivated me to see how easy it would be to find these chemicals in consumer products. The answer: very easy. In fact, while you’ve probably not heard of many of these chemicals, the products that contain them are likely all too familiar.

For decades our main chemical safety law offered little protection against toxic chemicals. Badly outmoded and outdated, the Toxic Substances Control Act of 1976 could not even restrict a known carcinogen like asbestos. Fortunately, last year, an overwhelming bipartisan majority in Congress passed legislation to reform the law. Included in that new law, the Lautenberg Act, was a requirement that EPA identify the first 10 chemicals to undergo risk evaluations. EPA released that list in late November, and included chemicals ranging from household names like asbestos to less well-known ones like Pigment Violet 29. All 10 chemicals had already been designated by EPA as chemicals in need of additional scrutiny.

To begin my toxic scavenger hunt, I had to first figure out which products use these chemicals. That is harder than it might sound. Companies are not required to include most ingredients on product labels (you can see that for yourself right now, if you have a cleaning product within sight).  Nor are there comprehensive databases listing where chemicals are used—even chemicals that pose serious health and environmental concerns, like these 10 chemicals.

To figure out which products use these chemicals, I had to resort to some advanced Googling. I found some products by searching online for Safety Data Sheets containing the chemicals—these sheets of product information are required by OSHA for potentially harmful substances used in the workplace. Other products and product categories can be found by searching EPA’s CPCat: Chemical and Product Categories database and the National Institute of Health (NIH) Household Products Database. The databases are not exhaustive and are further limited because product formulations change often, so all of these sources had to be confirmed using other information.

Many product categories have no ingredient disclosure whatsoever. For instance, a flame retardant on the list (HBCD) is used in electronics, textiles and elsewhere, but little or no disclosure is required for such products. Even so, product testing has turned up some specific uses—as an example, the Ecology Center tested children’s car seats and found the flame retardant HBCD in certain models. Still, there’s just no way to know for sure where else that chemical might be found in our homes or workplaces.

Where products using these chemicals were identified, however, finding out how I could obtain the products was a cinch (see my list).

The Authors Desk

The Author’s Desk

Amazon is my go-to vendor for everything from diapers to razors—and it turns out it can also supply me with products containing PERC, 1-Bromopropane, TCE and many more.

I also found that purchasers’ reviews provided interesting insights. Lectra Clean Degreaser uses PERC. One Amazon reviewer gives the product 5 out of 5 stars, noting “I always keep a couple cans of this handy. It’s also an amazing bug killer. It will kill any fly, wasp or nuisance bug almost instantly upon contact. Put the small red tube in and you’ve got about 8 feet of accurate Armageddon for our insect friends.”  Now there’s a reasonably foreseen use the product manufacturer perhaps didn’t intend!

The labels on these products are also of interest. At my local hardware store, I picked up a NMP-based paint stripper. That product is sold under the brand “Back to Nature” and includes a logo that urges browsers to “Go Green.” That’s pretty upbeat language for a suspected reproductive toxicant.

Generally, hardware stores are great places to find the chemicals on the first-10 list. Paint strippers using NMP and Methylene Chloride are readily available. Carbon Tetrachloride can be found in adhesives. Craft and hobby stores are good places to find others, like Pigment Violet 29 (used in some permanent violet paints) and 1-Bromopropane in certain adhesives.

asbestos in a box

Asbestos brakes

Nothing can beat an auto supply provider, however. There you can find TCE, PERC and 1-Bromopropane products for degreasing. It’s also where I located the coup de grace in the toxic chemical hunt: asbestos brake pads. Despite EPA’s inability to ban asbestos under the old chemical law, asbestos use has been curtailed by lawsuits, thanks to a clear link to mesothelioma. Still, both the state of California and domestic brake manufacturers indicate that asbestos remains in use in certain imported brake pads, as well as in some stockpiles of after-market brake pads for older-model cars. An online auto supply vendor shipped me asbestos brake pads, loose and unwrapped, rattling around in a flimsy cardboard box that includes a small warning label “contains asbestos fibers, avoid breathing dust.”

We can chuckle a bit at how casual a company was in shipping a product containing a deadly carcinogen, but this is serious stuff. The men and women who work with asbestos brake pads can get deathly sick, and so can their families when the fibers come home on clothing. Paint strippers containing methylene chloride are responsible for numerous deaths—people killed at work or at home.

Mechanics using brake cleaners in auto shops, janitors using stain removers, and dry cleaners using spot cleaning products are likely putting their health at risk every day at work. Pregnant women using these products, say, to prepare a nursery, might inadvertently be harming their developing fetus.

Tuesday, EPA will take the next step on these 10 chemicals, holding a public meeting to discuss and get input on what the scope of their risk evaluations should be (see their use dossiers on each of the 10 chemicals here). We should all watch closely and participate where we can to ensure that workers, kids, pregnant woman, and everyone else get the protection they deserve. And if you know of any other products containing these chemicals, please let me know. I still have some room on my desk.

Read more