Enviroshop – About Magazine

Which path will the USDA choose: Transparency or a cover-up and collusion?

The HSUS lawsuit originally pulled the USDA in the right direction, but a much more recent lawsuit by two individuals in Texas cited for horse soring appears to have been tugging the agency in the opposite direction.

The HSUS lawsuit originally pulled the USDA in the right direction, but a much more recent lawsuit by two individuals in Texas cited for horse soring appears to have been tugging the agency in the opposite direction. Photo by The HSUS

The coalition of groups demanding that the U.S. Department of Agriculture restore inspection reports and violation notices called for under the Animal Welfare Act and the Horse Protection Act is growing at a rapid pace and strengthening its reach. Last week New York Attorney General Eric Schneiderman, a Democrat, and former U.S. Senate Majority Leader . . . 

The post Which path will the USDA choose: Transparency or a cover-up and collusion? appeared first on A Humane Nation.

Related Stories

Read more

REPORT: CA Utilities Are Leaking Lots of Gas – but There’s a Way to Stop It

By Amanda Johnson

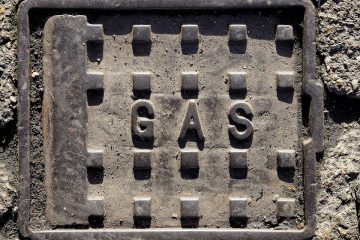
A new report confirms with greater accuracy than ever before that California natural gas utilities are letting huge amounts of their product escape into the atmosphere – about 6.6 billion cubic feet in 2015. That’s more than the amount of gas released during last year’s Aliso Canyon disaster, and over twice the total loss from all of the state’s oil and gas wells.

These huge gas losses are a major environmental problem. Methane – the main ingredient in natural gas – is a potent climate pollutant.  Leaks and other emissions from California utilities in 2015 have the same climate impact as burning more than 1 billion gallons of gasoline.

Where the data comes from and what it means

In 2014 California passed SB 1371, a new law requiring utilities to reduce methane emissions. This new report is based on emissions data collected under that law. 

The report estimates that about 78% of gas leaks occur at four kinds of sources: Customer meter sets; metering and regulating stations; ungraded leaks; and intentional venting.

This data also allows the state to track progress against newly-legislated methane reduction goals like the one included in SB 1383 which sets a target of 40% emissions reductions below 2013 levels.

Changing the way we pay for gas

While the accuracy of the data is better than ever before, the estimates are still conservative because they are based on emissions factors and leak estimates, rather than direct measurements. And the emissions are likely to go up before they go down. That’s because leak detection and quantification technology required under SB 1371 is better equipped at finding leaks – meaning utilities will start accounting for more leaks with each survey.

Based on an average wholesale market price of gas, these loses mean ratepayers are paying approximately $18 million every year for gas that is never delivered.

The issue of what to do about the value of lost gas – and the resulting incentives for additional leak reduction – will be an important conversation. SB 1371 asks the Commission to adjust the amount that utilities can charge customers based on actual leakage volumes, meaning the companies may no longer get paid for gas that leaks from their pipes before it’s delivered to the customer.

Two utilities, two different strategies for reducing gas leaks

While the report reveals troublingly high emissions we also know that California’s two largest gas utilities, PG&E and SoCalGas, are committing to new efforts to reduce methane pollution. Their public filings, however, point to markedly different strategies.

PG&E has already begun implementing most of the practices proposed by CPUC as part of SB 1371. These include modern mobile leak detection equipment, faster leak survey, and a reorganized leak repair processes to bundle and fix leaks faster and more efficiently.

In contrast, SoCalGas – the nation’s largest gas utility, and the company responsible for the Aliso Canyon gas leak – appears to be dragging its feet. The utility argues against the practices recommended by CPUC and embraced by PG&E and other leading utilities, arguing that they are ineffective at finding and helping reduce lost gas.

These differences in utility commitment to reducing emissions may be softened by providing the public with an accurate and transparent report of emissions. Utilities will be more inclined to ensure their actions actually reduce emissions if they are held accountable by the public.

How better transparency can improve emissions reductions efforts

SB 1371 requires the Commission to provide the public with accurate information about the number and severity of gas leaks. The report aggregated the data of all the utilities and storage facilities but did not specify utility-specific statistics. The companies posted some of the data publicly on their websites only after requests by EDF, even though public transparency is required under the law.

Obscuring the origin of emissions is inconsistent with other air pollution and climate change reporting requirements at California Air Resource Board or the EPA. Air pollution data is public, and California ratepayers have a right to see a transparent evaluation of their utilities emissions profile. In the future, the CPUC should show total emissions for individual utilities more clearly, including labeling their share of leaks and emissions in each category.

Only by portraying emissions from individual utilities, instead of industry-wide aggregated data, will transparency requirements be satisfied. Public accountability will also help to ensure utilities stay motivated and continue to reduce their emissions. The Commission should not shy away from showing ratepayers which utilities are achieving the most gains. Not only will these steps give the public and utility ratepayers transparent analysis, it will ensure the utilities know which emissions to prioritize.

Image source: Max Pixel

Read more

No time to be a bystander, as animals are threatened by hard-hearted politicians

Animals' needs aren’t partisan and shouldn’t be partisan. Dragging animal welfare into the R-vs-D fray is a source of shame – no matter what your political leanings.

Animals’ needs aren’t partisan and shouldn’t be partisan. Dragging animal welfare into the R-vs-D fray is a source of shame – no matter what your political leanings. Photo by Thomas D. Mangelsen/ www.mangelsen.com

Traveling home to their districts, members of Congress are hearing from riled-up constituents like never before – and right on the heels of a tremendously contentious election. On Capitol Hill, telephone lines are being overwhelmed repeatedly by the fresh concerns of Americans roused to action. In cities across the country, citizens are organizing, vowing to . . . 

The post No time to be a bystander, as animals are threatened by hard-hearted politicians appeared first on A Humane Nation.

Related Stories

Read more

EDF’s assessment of a health-based benchmark for lead in drinking water

By Tom Neltner

Tom Neltner, J.D.is Chemicals Policy Director

Health professionals periodically ask me how they should advise parents who ask about what constitutes a dangerous level of lead in drinking water. They want a number similar to the one developed by the Environmental Protection Agency (EPA) for lead in dust and soil (which is the primary source of elevated blood lead levels in young children). I usually remind them that EPA’s 15 parts per billion (ppb) Lead Action Level is based on the effectiveness of treating water to reduce corrosion and the leaching of lead from plumbing; it has no relation to health. Then I tell them that EPA is working on one and to hold tight. Admittedly, that is not very satisfying to someone who must answer a parent’s questions about the results of water tests today.

On January 12, EPA released a draft report for public comment and external peer review that provides scientific models that the agency may use to develop potential health-based benchmarks for lead in drinking water. In a blog last month, I explained the various approaches and options for benchmarks that ranged from 3 to 56 ppb. In another blog, I described how EPA’s analysis provides insight into the amounts of lead in food, water, air, dust and soil to which infants and toddlers may be exposed. In this blog, I provide our assessment of numbers that health professionals could use to answer a parent’s questions. Because the numbers are only a start, I also suggest how health professionals can use the health-based benchmarks to help parents take action when water tests exceed those levels.

EDF’s read on an appropriate health-based benchmark for individual action on lead in drinking water

When it comes to children’s brain development, EDF is cautious. So we drew from the agency’s estimates calculated by its model to result in a 1% increase in the probability of a child having a blood lead level (BLL) of 3.5 micrograms of lead per deciliter of blood (µg/dL).

EDF’s assessment of a health-based benchmark for individual action on lead in drinking water
Age of child in home and type of exposure Houses built before 1950¹ Houses built 1950 to 1978² Tests show no lead in dust or soil³
Formula-fed infant 3.8 ppb 8.2 ppb 11.3 ppb
Other children 7 years or younger 5.9 ppb 12.9 ppb 27.3 ppb

As you consider the appropriate number, keep the following in mind:

  • There is no safe level of exposure to lead in children’s blood. The public health goal is always 0 ppb but it is difficult to translate into action on an individual home. The health-based benchmarks are designed to help public health professionals provide practical advice to parents.
  • Since a health professional is typically focused on actions an individual should take, we selected a number representing a child having a less than 1% chance of having an elevated BLL.
  • We used 3.5 µg/dL instead of the Reference Value of 5.0 µg/dL established by the Centers for Disease Control and Prevention (CDC) in 2012 because CDC is expected to lower the level to 3.5 µg/dL later this year. This CDC Reference Value is referred to by EPA as the elevated BLL.
  • The levels are for the amount of lead in drinking water actually consumed. Water test results can vary based on a number of factors, including the sampling method. If a resident conducted the water test for a utility to ensure compliance with the Lead and Copper Rule, the sample was the first liter of water coming from the cold water tap at the kitchen sink after it sat in the faucet overnight. This sample most likely overestimates the exposure. However, if the home has a lead service line (LSL) or lead pipes in internal plumbing, actual exposure may be more or less than the level found in the first liter depending on the condition of the pipe. Finally, lead levels change with the seasons and water chemistry; a single test will miss these changes.
  • The numbers come from a draft report. EPA is seeking public comment and convening an expert peer review panel to provide guidance. When it issues proposed revisions to the Lead and Copper Rule, hopefully by the end of 2017, the numbers may very well change.
  • One of the reasons the health-based benchmarks for children between 1 and 7 years old are much higher than those for formula-fed infants is that they drink much less – less than half – the amount of tap water.

EDF’s suggestions for how health professionals can use the health-based benchmark

If the water tests are above the appropriate health-based benchmark, we suggest health professionals take the following steps.

Step 1: Always consider paint. Lead-based paint remains the primary source of lead exposure to children with elevated BLLs. Low income and minority children remain at the greatest risk. When the paint is disturbed or deteriorated, it may contaminate soil and dust that a child can ingest. If the home is built before 1978, educate the resident on the hazards and suggest testing the soil, floors and window sill. Provide them EPA’s Protect Your Family from Lead in Your Home pamphlet. It is far from perfect, but it is useful.

Step 2: Determine whether the home has an LSL. Call the drinking water utility to see if they know or check their website as more and more communities are making the information available on-line. When you are in the home, if you can, check the water line as it comes into the house. National Public Radio has a good demonstration of how to do this check. If you have a portable X-ray fluorescent (XRF) lead paint analyzer, you can use it instead of scratching the pipe. If the home has or may have an LSL, advise the resident to work with the utility to have it safely removed since it can unpredictably release high levels of lead that may be missed by a one-time water test. Some communities are offering innovative ways to help offset the replacement costs. Until the LSL is replaced, suggest the resident periodically test the water and consider a filter to remove lead in the drinking water, especially if young children, pregnant women, or a formula-fed infant lives there. Flushing is a lower cost alternative, but may take several minutes to clear the water that has been sitting in the LSL. If there is no LSL, only a few seconds of flushing may be needed.

Step 3: Understand the sample method and results. Testing is typically performed on water samples taken from the first liter coming from the cold water tap at the kitchen sink after it sat in the faucet overnight. This method is how utilities evaluate compliance with EPA rules and, unless there is an LSL, may overestimate typical lead levels in the water. Consider taking another sample after flushing the line and letting it sit for 30 minutes. It should have non-detectable levels of lead and demonstrate the benefits of flushing before use. You may also want to test the water from the bathroom where children may get their water during the night.

Step 4: Provide basic educational materials to help residents reduce lead in their drinking water. The National Drinking Water Alliance has useful materials on its website including excellent fact sheets for renters and condo owners and for homeowners.

Conclusion

Testing water can help residents better understand how much lead may be in the water they drink. The results are most useful when compared to a health-based benchmark that is relevant to the resident’s situation. Health professionals can help individuals understand the health risks associated with the lead levels, and provide useful suggestions for them to take appropriate steps to reduce their exposures and be more confident that the water they and their children drink is safe.


¹ For homes without lead in dust or soil, we used Exhibit 22 with a lead in soil and dust of 0 µg/g.

² For pre-1950 homes, we used EPA’s Exhibit 50, which is based on the geometric mean of lead in soil of 221 µg/g (Exhibit 7) and dust of 134 µg/g (Exhibit 8).

³ For homes built after 1950, we used Exhibit 22 with a lead in soil of 37 µg/g and dust of 72 µg/g. This is similar to the levels reported by EPA for housing built after 1950 of 23 µg/g and dust of 63.7 µg/g.

Read more

Guatemala passes omnibus anti-cruelty law, striking blow against wide range of practices

This landmark animal welfare law approved today by Guatemala’s Congress will, for the first time, penalize animal cruelty and its perpetrators, and implement strong protections for animals across a spectrum of other fronts.

This landmark animal welfare law approved today by Guatemala’s Congress will, for the first time, penalize animal cruelty and its perpetrators, and implement strong protections for animals across a spectrum of other fronts. Photo by Swoan Parker/For HSI

Guatemala, Central America’s biggest and most populous nation with more than 15 million people, has adopted one of the world’s most comprehensive anti-cruelty laws – an omnibus measure that, in addition to its basic anti-cruelty provisions, creates protections for wildlife, companion animals, animals used in research, and animals used in circuses. It bans animal testing . . . 

The post Breaking news: Guatemala passes omnibus anti-cruelty law, striking blow against wide range of practices appeared first on A Humane Nation.

Related Stories

Read more

Saving Energy and Doubling Worldwide Water Supplies – One Drip at a Time

By Kate Zerrenner

Netafim HQOn a warm December day, I stood in a jojoba field in the Negev Desert in southern Israel and watched water slowly seep up from the ground around the trees. First a tiny spot, then spreading, watering the plants from deep below. This highly efficient system is known as drip irrigation, and I was there to meet with the world’s leading drip irrigation company, Israel-based Netafim.

Naty Barak, the Netafim director who I met on the visit, notes that if the world’s farmers increased their use of drip irrigation to 15 percent (up from just under 5 percent now), the amount of water available for use worldwide could double.

Drip irrigation saves more than water. Whereas traditional irrigation typically uses quite a bit of energy, drip reduces the pressure (and power) needed to get the water to the crops while reducing the need for energy-hungry fertilizers. Plus, due to the inextricable link between water and power, saving water results in further saved energy.

Texas has already enhanced its water efficiency, but it could go further and take a page out of Israel’s book. By investing in thoughtful drip irrigation now, Texas could lead the nation on expanding this innovative technology and significantly reduce the energy footprint of its irrigation sector, while protecting water supplies for our growing cities and creating more sustainable farming practices.

Lead image: Netafim headquarters. Above: Listening to Naty Barak and the farmer who works the jojoba field.

Lead image: Netafim headquarters. Above: Listening to Naty Barak and the farmer who works the jojoba field.

Opportunity for enhanced efficiency

First, a little context. In the US, about 33 percent of our water is used for irrigation (compare that with 45 percent for thermoelectric power). Texas ranks second in the country, after California, for agricultural products and has more than 10 percent of the irrigated acres in the US, with about 57 percent of water used in Texas for irrigation. Due to efficiency and technology advancements in the irrigation sector, that amount of water use has remained about the same since the 1970s, despite increases in crop yield.

Yet nearly all of Texas still relies on technologies that use more water than necessary, such as sprinklers, flood, and furrow irrigation. Only about 3 percent of Texas fields are irrigated with drip irrigation. In comparison, 75 percent of Israel’s crops are irrigated by drip – a huge increase over Texas, and even over California’s 30 to 40 percent.

Clearly, the Lone Star State and the rest of the country have the potential to significantly increase the use of this energy- and water-efficient technology. And further technological advancements are in the works, with Texas at the forefront. In 2015, James Bordovsky, one of the senior scientists at Texas A&M AgriLife Research, received an international award from Netafim for his decades of practical research into increasing water efficiency in the cotton production areas of the High Plains region of West Texas.

Protecting food supplies

If deployed thoughtfully, drip technologies could help ensure the sustainability of farmers in the state and other dry areas.


Saving Energy and Doubling Worldwide Water Supplies – One Drip at a Time
Click To Tweet


For example, a potential game changer is the use of drip irrigation in rice cultivation. Netafim has introduced drip systems in India, Taiwan, and other countries that produce rice. By switching from traditional flood irrigation, these farmers can expect both water and power savings of 60 to 70 percent. In Central Texas, rice farmers weren’t given their water allotments for four years during the most recent drought because their rights were junior to others, such as cities. With drip technology, they would be able to farm with less water and drought conditions wouldn’t present as big of a threat.

Additionally, during both Texas and Israel summers, the hot, dry conditions mean crops may need additional water. At the same time, increases in electric demand for air conditioning adds pressure to already stressed and thirsty grids. Lowering irrigation’s water and energy demand can help ensure crops get the water they need, and people have the power they need.

Growing demands

Drip irrigation worldwide could help us meet our food, water, and energy demands for a growing population. For example, the Dallas, Austin, and Lower Rio Grande Valley areas of the state are expected to increase municipal water demand by 90 percent by 2060, due to population growth. Texas needs to ensure that water supplies are available for all its needs, and increasing efficiency in the agricultural sector can help us meet cities’ demands, too.

Increasing water and energy efficiency in the agricultural sector can help meet Texas’ needs.

It should be noted that sometimes drip irrigation actually increases the total amount of water a crop uses. This is because the technology improves how well a crop can grow, thus increasing crop productivity and water use. That said, thoughtful use of drip irrigation can be highly valuable.

Netafim has created an oasis in the Israeli desert, a powerful image compared to pictures of a barren, extra-terrestrial landscape that existed before drip irrigation. To ensure the sustainability of Texas farmers, an easy step for state policymakers would be to support – financially and practically – incentives and efforts to help farmers take advantage of this water- and energy-saving process. Support could come in the form of teaching the technology’s benefits, especially to smaller farms, technical training, and financing for the initial purchase of drip irrigation equipment. Doing so can protect our food, water, and energy supplies. In a changing climate, a vision of an oasis in the desert is a comforting thought.

Editor’s note: Kate was a guest of Vibe Israel, a non-profit organization leading a tour called Vibe Eco Impact in December 2016, which explores sustainability initiatives in Israel.

Photo source: Shani Sadicario

This post originally appeared on our Energy Exchange blog

Read more