Enviroshop – About Magazine

Food waste, guilt and the millennial mom: how companies can help

By Jenny Ahlen

edf-business-of-food-blog-graphic_shelton-grp_12-7-16I spend a lot of time these days thinking about food waste.

Why? First, I’m the mother of a toddler who oscillates between being a bottomless pit, easily cleaning her plate, to being a picky eater who only takes a couple of bites before the bulk of her meal ends up in the trash.

Second, I’m married to a chef who, because he’s a smart businessman, runs his kitchen with the precision of a comptroller: wasted food means lost profit, so every scrap of food is utilized wherever possible.

Finally, I interface almost daily with Walmart, the world’s largest grocer. Walmart recently pledged to root out 1 gigaton of greenhouse gas reductions from its global supply chain, and I’m certain that food waste will play an integral part in reaching that goal.

But before you conclude that I’m an outlier—some sort of obsessive, “food waste weirdo”— a recent study shows that I’m not the only one struggling with this issue:

Now we all know that just because one feels guilty about something doesn’t mean one’s behavior will change.  Cost, however, is a frequent driver of behavior, so consider these numbers:

In other words, 2.5-4% of the 2015 US median household income is being thrown away! That’s bad news for our wallets—and our planet (NRDC estimates that food rotting in landfills accounts for 16% of U.S. methane emissions).

So it’s a no-brainer that wasting food serves no one’s interests.  What’s not so clear is: what can be done about it?

A business opportunity… with a coveted consumer

This is where I see a real opportunity for grocers—like Walmart—and the food companies that fill their shelves. For the most part, these companies are talking non-stop these days about how to win over the most coveted customer of all, the “millennial mom”.

Inviting millennial moms to be partners on eliminating food waste could be the perfect strategy. They jenny_helen_expertare young (meaning they have years of brand loyalty ahead of them), cost-conscious and environmentally engaged; saving them money while alleviating their food waste guilt is a clear win-win.

I’m not saying this will be easy; that same study reveals that real barriers exist:

However, while conceding that it’s difficult (if not downright un-wise) to portray millennial moms as a monolithic group, marketing profiles of these women consistently portray them as, a.) hungry for information about products; and b.) willing to take action on issues… but only if roadblocks or impediments have been removed.

So, grocers and food companies, how can you burnish your brand with millennial moms while making a real dent in food waste?

Step number 1: engage and educate

Run marketing campaigns, both in-store and out, that will inform these coveted customers on:

  • Proper handling and storage of their food to minimize spoilage; and
  • How to fully utilize their food purchases. In other words, teach them to think like my husband, the chef, so they can make use of scraps and leftovers.

Step number 2: make it easy

Design and implement initiatives that make for fun, easy adoption:

  • Clarify date labeling so that perfectly good food isn’t perceived as bad. The USDA just requested that companies switch to “best if used by” language to give consumers more accurate guidance.
  • Suggest meals that enable moms to buy just what they need—and use it up. There’s a real business opportunity here: did you know that, as of 4 pm each day, 80% of mom’s don’t know what’s for dinner that night? Suggesting recipes that will be totally consumed will make her life easier!
  • Inspire composting (and discount composters)… their garden will thrive because of you! Or help make curbside composting possible like in Boulder, Seattle and San Francisco.
  • Be creative… people love to compete! Only 13.5% think that their household wastes more than their average neighbor (study). Help people understand that they may in fact be wasting way more food and money than their friends, family, and neighbors to motivate them to do something about it.

In the meantime, I will carry on, hopeful that while my daughter learns to clean her plate, an array of giant food companies and grocers will take up the mantle of tackling food waste on a massive scale.

Read more

At last: EPA promulgates nanomaterial reporting rule

By Richard Denison

Richard Denison, Ph.D.is a Lead Senior Scientist. Lindsay McCormick is a Project Manager.  

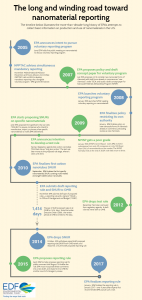
nanomaterial-infographic

Today, EPA issued its long-awaited rule to gather risk-relevant information on nanoscale materials. The new rule will finally allow EPA to obtain basic data on use, exposure, and hazards from those that manufacture or process these materials, which has long been recognized by experts as essential to understand and manage their potential risks.

Nanomaterials – a diverse category of materials defined mainly by their small size – often exhibit unique properties that can allow for novel applications but also have the potential to negatively impact our health and the environment.  Some nanomaterials:  more easily penetrate biological barriers than do their bulk counterparts; exhibit toxic effects on the nervous, cardiovascular, pulmonary, and reproductive systems; or have antibacterial properties that may negatively impact ecosystems or lead to resistance.

Numerous expert bodies have identified the need for the kinds of information on nanomaterials EPA will now be able to collect, including the National Academy of Sciences, the National Nanotechnology Initiative, and EPA’s Office of Research and Development.  The Organization for Economic Cooperation and Development (OECD) published a report last year noting that the number of products containing nanomaterials increased fivefold in the global market between 2006 and 2011, and are being used in hundreds of new products ranging from cosmetics and personal care products to clothing and textiles, solar cells, plastics for the automotive and aircraft industries, and food packaging.

EPA’s new rule institutes a one-time reporting requirement for existing nanomaterials, as well as a standing one-time reporting requirement for new nanomaterials before they are manufactured.  Companies that manufacture, import or process existing nanomaterials, or intend to start doing so for a new nanomaterial, are required to submit the following categories of “reasonably ascertainable” information to EPA:  chemical identity, production volume, methods of manufacture and processing, exposure and release information, and available environmental and health impacts data.  By collecting such data, EPA will finally be able to draw a clearer picture of the nanomaterials in and entering commercial use, and better determine whether action to mitigate risk is needed, on a case-by-case basis.

This basic rule has been a very long time coming.  As illustrated in the graphic above, EPA has been attempting – for over a decade – to issue such a rule to gather even this most basic information on nanomaterials in the U.S. market.  Over the years, we have blogged extensively on EPA’s slow progress, due to opposition from both industry and other parts of the Federal government at every step.

There are a number of notable aspects of what is included – and not included – in the final rule:

  • It applies both to nanoscale materials already in commerce and to new nano forms of existing chemicals that companies intend to make or process in the future. (Wholly new nanoscale chemicals would be required to be reviewed under TSCA’s new chemicals provisions.)
  • In promulgating the rule, EPA affirmed its broad authority to collect existing information under section 8(a) of TSCA, rejecting industry arguments that such authority was highly constrained.
  • EPA removed reporting exemptions it had proposed for nanoclays and zinc oxide, and rejected industry calls to include numerous additional exemptions.

The rule is not perfect and omits reporting EDF and others urged be included.  For example:

  • Aggregates of nanoscale particles must fall within the 1-100 nanometer (nm) range to be reportable. We argued that aggregates comprised of nanoparticles between 1-100 nm be reported even if the aggregate is larger, given that such aggregates can often disaggregate in the environment or during use.
  • Companies that submitted a pre-manufacture notice (PMN) for a nanoscale material at any time since 2005 do not have to report for that material. Our concern is that this will miss new information on that material that has been developed since the PMN was reviewed.
  • Chemical substances “formed at the nanoscale as part of a film on a surface” are exempted from reporting. We argued that such films can break down or erode over time especially if exposed to the elements, potentially releasing the nanoscale materials.

Still, with this rule finally finalized, EPA can at last begin to get basic risk-relevant information needed to make sound decisions about which materials and uses present concerns and which do not.


For more detail on the history of this rule, see these earlier blog posts:


Read more

FDA finds more perchlorate in more food, especially bologna, salami and rice cereal

By Tom Neltner

Tom Neltner, J.D.is Chemicals Policy Director and Maricel Maffini, Ph.D., Consultant

Last month, the Food and Drug Administration’s (FDA) scientists published a study showing significant increases in perchlorate contamination in food sampled from 2008 and 2012 compared to levels sampled from 2003 to 2006. The amount of perchlorate in foods infants and toddlers eat went up 34% and 23% respectively. Virtually all types of food had measurable levels of perchlorate, up from 74%. These increases are important because perchlorate threatens fetal and child brain development. As we noted last month, one in five pregnant women are already at great risk from any perchlorate exposure. The FDA study doesn’t explain the increase in perchlorate contamination. Yet, it’s important to note that there is one known factor that did change in this time period: FDA allowed perchlorate to be added to plastic packaging.

Reported perchlorate levels in food varied widely, suggesting that how the food was processed may have made a significant difference. The increase in three foods jumped out to me:

  • Bologna: At a shocking 1,557 micrograms of perchlorate per kilogram (µg/kg), this lunchmeat had by far the highest levels. Another sample had the fifth highest levels at 395 µg/kg. Yet a quarter of the other bologna samples had no measurable perchlorate. Previously, FDA reported levels below 10 µg/kg.
  • Salami: One sample had 686 µg/kg giving it a third ranking. Other samples showed much lower levels and six of the 20 had no detectable levels of perchlorate. Previously, FDA reported levels below 7 µg/kg.
  • Rice Cereal for Babies: Among baby foods, prepared dry rice cereal had the two highest levels with 173 and 98 µg/kg. Yet, 15 of the 20 samples had non-detectable levels of perchlorate. Previously, FDA reported levels less than 1 µg/kg.

The increases are disturbing in light of the threat posed by perchlorate to children’s brain development and the emerging science showing the risk at lower levels is greater than thought a decade ago. The risk is particularly significant for children in those families loyal to those brands with high levels. Unfortunately, FDA’s study does not identify the brand of food tested.

What might explain the increase in perchlorate contamination?

The only action we can document is FDA’s decision in 2005 to allow as much as 12,000 parts per million (ppm) of perchlorate to be added as an anti-static agent to plastic packaging for dry food with no free fat or oil. The packaging can be used for final products or raw materials before or during processing. Even if the final product is a liquid, raw materials such as rice, whey, sugar, starch, or spice may have contacted the perchlorate-laden plastic. The FDA decision was made in late in 2005 and sampling from the first study ended in 2006.

A Freedom of Information Act request by the Natural Resources Defense Council (NRDC) showed that FDA’s decision was based on a flawed and outdated assumption that perchlorate would not migrate into food at significant levels. Tests provided by the manufacturer late in 2015, in response to a food additive petition from NRDC and others, showed that perchlorate did indeed migrate into food, most likely from abrasion as the food flows in and out of the package. The petition asked FDA to reverse its 2005 decision and ban use of perchlorate. When FDA missed the June 2015 statutory deadline for a decision on the petition, NRDC and others sued the agency to force action. The agency told the court that it aims to make a final decision by March 2017.

What does FDA’s analysis say?

For more than 40 years, as part of its Total Diet Study, FDA has collected samples of more than 280 types of food every year from three randomly-selected cities in four regions of the country. It blends the samples from each of the three cities and analyzes the composite sample for various chemicals, such as heavy metals, nutrients, pesticides and other substances. The agency samples more than 50 types of baby food, including three types of infant formula. The agency also tests bottled water but not tap water. The agency does not report the brands sampled.

Periodically, the agency posts the results on its website and publishes studies evaluating its findings. In response to concerns with perchlorate contamination of produce and dairy, FDA published a study in 2008 summarizing the results from samples collected from 2003 to 2006. It provides updates on a webpage dedicated to the chemical.

On December 21, 2016, FDA published its latest article reporting the results for samples collected from 2008 to 2012 and compared them with those collected from 2003 to 2006 using two different statistical methods. The study provides supplementary data that includes the analytical results but does not identify the year or region from which the samples were collected. Neither the article nor the analytical results are yet available on the agency’s webpages dedicated to perchlorate or the Total Diet Study.

FDA estimated dietary intakes for 14 distinct age/sex groups. Infants and toddlers had the highest estimated consumption with 0.36 and 0.43 μg/kg-bw/day respectively.  Infants had a 34% increase in perchlorate exposure compared to the foods purchased before and around the time of FDA’s approval to use perchlorate in food packaging. More than half of the infant exposure came from baby food, including infant formula. Two-year old children’s exposure increased 23%. More than half of their exposure came from dairy products.

What should FDA do?

FDA’s compelling data on the significant increase in perchlorate exposure from the food we feed our children since its approval of perchlorate added to packaging should prompt the agency to act now to ban its use in contact with food. This decision cannot come fast enough. FDA must remedy a problem of its own making, and protect what many of us value the most—our children’s health and their ability to learn and thrive to their fullest potential.

Read more

A six-month reprieve for Yellowstone’s grizzlies

There are approximately 700 grizzly bears in the Greater Yellowstone area, and wildlife managers have cataloged more than 100 grizzly deaths during the past two years – most of them human-caused.

There are approximately 700 grizzly bears in the Greater Yellowstone area, and wildlife managers have cataloged more than 100 grizzly deaths during the past two years – most of them human-caused. Photo by Alamy

The Obama Administration has passed a flaming-hot coal to the Trump Administration – pushing to the incoming leadership at the Interior Department the decision to remove federal Endangered Species Act protections from grizzly bears. Yesterday, news outlets reported that a Rocky Mountain region official with the U.S. Fish and Wildlife Service said that the agency . . . 

The post Breaking news: A six-month reprieve for Yellowstone’s grizzlies appeared first on A Humane Nation.

Related Stories

Read more

Cincinnati and Ohio show leadership in identifying and disclosing lead service lines

By Tom Neltner

Tom Neltner, J.D.is Chemicals Policy Director

Transparency is an essential aspect of any successful program to reduce lead in drinking water. Knowing if you have a lead service line (LSL)—the pipe that connects the main under the street to the building—can help you decide whether to use a filter or replace the line. If you are looking for a home to rent or buy, the presence of a LSL can be a factor in your choice. Transparency can also help reassure consumers that their utility is aware of the problem and committed to protecting their health. The challenge for many water suppliers is that they often don’t have perfect information about the presence of LSLs. But incomplete information is not a reason for failing to disclose what is known, what is uncertain, and what is unknown.

In a February 29, 2016 letter to the states, U.S. Environmental Protection Agency (US EPA) asked states to increase transparency by posting on either the state’s website or have it posted on local utilities’ websites:

“the materials inventory that systems were required to complete under the [Lead and Copper Rule] including the locations of lead service lines [LSLs], together with any more updated inventory or map of lead service lines and lead plumbing in the system.”

In response to this letter and systemic issues brought to light about lead in drinking water in the village of Sebring, Ohio and Flint, Michigan, the State of Ohio enacted pragmatic legislation crafted by Governor John Kasich’s administration and the Ohio Environmental Protection Agency (Ohio EPA). Among its supporters was the Ohio Environmental Council. One provision in the law requires community water systems to

“identify and map areas of their system that are known or are likely to contain lead service lines and identify characteristics of buildings served by the system that may contain lead piping, solder, or fixtures . . .”

Utilities must submit the information to Ohio EPA as well as the departments of Health and of Job and Family Services by March 9, 2017 and update this information every five years.

To help utilities comply, Ohio EPA released draft guidance in September 2016 and laid out four resources to identify buildings likely to contain LSLs: 1) code and regulatory changes; 2) historical permit records; 3) maintenance and operation records; and 4) customer self-reporting. It recommended that utilities submit the maps in PDF format and identify areas likely or known to contain LSLs using different colors.

Ohio’s three largest cities, Cincinnati, Cleveland and Columbus, have taken different approaches to LSL transparency. Cincinnati embraced the requirement and took it a step farther.  It provided detailed on-line maps, modeled off Washington DC’s approach, enabling the public to search an address or view a map that tells them whether or not the service line is made of lead or if the material is unknown. The city provides information for both the portion of the service line owned by the utility (referred to as the “public side”) and the line on private property (referred to as the “private side”). It uses the best available information but does not guarantee accuracy.  Users must click on a disclaimer to access the site. Consistent with Ohio EPA guidance, the city invites customers to submit updated information to the utility by email. This level of detail allows any consumer to make informed choices whether they are buying or renting a home, picking a child-care facility, or deciding whether to use a filter.

In contrast, Cleveland has not gone as far as Cincinnati.  It has an on-line address search tool supplemented with static color-coded map. The tool only provides address-specific information on the public side of the service line but not the private side. This risks giving users the false impression that the lack of a LSL on the public side means that there is no LSL when there may still be lead pipe on the private side. However, Cleveland reports that preliminary surveys show that less than 3% of lines on private property as lead pipe.

Cleveland reported to me that it is open to considering an interactive map similar to Cincinnati and providing an option to allow customers to provided updated information.  This interactivity should make it easier for potential renters and homebuyers to scan a neighborhood to identify homes without LSLs.

In response to my inquiry, Columbus reported that it will submit a map similar to Cleveland and make it publicly available within the next month or so.  The map will be a PDF showing areas where their records indicate a home has a publically-owned lead service line. They are evaluating a searchable database as a possible future enhancement.

Replacing lead pipes is one of the best means for reducing the risk of lead exposure from water—a major source of lead after paint. A critical step towards this goal is building an inventory of LSLs, starting with the best available information—what is known and what isn’t known. While it may be a difficult step for a utility to admit it does not know whether the public or private side of a service line is made of lead, it is critical to make this information available in a user-friendly format that allows property owners to update and correct the information. The City of Cincinnati and State of Ohio serve as a model for other communities.

Read more

Political shots fired as American lawmakers renew war on wolves

Lawmakers are ignoring the fact that these apex carnivores occupy just a fraction of their original range and number only 5,000 across the entire lower 48 states.

Lawmakers are ignoring the fact that these apex carnivores occupy just a fraction of their original range and number only 5,000 across the entire lower 48 states. Photo by iStockphoto

Just days after the newly constituted Congress commenced its work in the new year, some legislators from the West and the Great Lakes region showed that they have their fangs out for wolves and other animals. They are threatening not just to enable a massive kill of the ecologically and economically beneficial native carnivores, but . . . 

The post Political shots fired as American lawmakers renew war on wolves appeared first on A Humane Nation.

Related Stories

Read more

Why Strategic Choices – and Water – Could Make People More Energy-Efficient

By Kate Zerrenner

At my household, a new year means a new energy and water-use baseline. By that I mean, every month, I look at how much electricity and water I used in comparison to the same month the previous year – so I can try to be as efficient as possible. But I work in the energy field, and I know that’s not a typical New Year’s tradition. Most people don’t examine the trends of their energy-use or spend much time thinking about how to reduce it.

So, what motivates the “average” person to take action and be more energy-efficient? It depends.

A recent study by the Pacific Institute for Climate Solutions and the American Council for an Energy Efficient Economy (ACEEE) looked at the psychology behind individuals’ energy efficiency behavior, and how that information could be used to design more effective programs.

The study came away with some fascinating findings that show electric utilities need to be strategic in the way they create, as well as communicate about, their efficiency programs. Moreover, it led me to believe showing how energy efficiency relates to water – the quality and availability of which many people care about – could help encourage people to be more mindful about their energy use.

Study takeaways

One false assumption often made when designing an efficiency program is, if you give the customer the information and tell them what to do, they will do it. But information alone will not lead people to change their behavior.

Information alone will not lead people to change their behavior.

In order to ensure people actually hear and act on the message, utilities should consider:

  • Tailoring messaging: Rather than simply talking about saving energy, the program could emphasize improving air quality or saving money, depending on your audience. For example, the study concludes “conservatives are more likely to respond to messages about ‘wasted energy’ or ‘climate change’ than to messaging about ‘global warming’.” But first, utilities have to learn more about their customers to understand the language that will work best.
  • The right messenger: People are social animals, and we are more likely to listen to a message from someone we know and trust. The study found that recruiting trusted leaders from a social network, like a neighborhood or church, would be more effective than having the information come from an outsider.
  • Giving feedback: Letting people know their actions are saving energy makes it more likely they will continue to engage in that behavior. Plus, “the more frequently personalized feedback is given, the more effective it tends to be.” Other studies have shown real-time energy-use feedback can result in up to 12 percent household savings.
  • Using pledges: A commitment to do something – like promising to turn off all appliances when not in use – makes people “more likely to follow through with their planned actions.”

How water could help make people more energy-efficient
Click To Tweet


The energy-water connection

Unless you live near a power plant or in a place with markedly poor air quality, you probably don’t think about how your own energy use can have a direct impact on the environment.

But what if you tied electricity to something more personal, like water?

I live in Austin, and my water comes from the Highland Lakes, a group of manmade reservoirs from the Colorado River just outside the city. I spent every summer as a kid swimming and boating in Lake Travis, part of the Highland group. In the worst year of the Texas drought, the beautiful Lake Travis looked like a mud pit. Businesses and marinas closed because the water no longer made it to what had been the shore. I’ll never forget how that lack of water made me feel, and it still inspires me to use water wisely. 

Every time you turn your lights on, you might as well be turning on the faucet, too. 

Connecting water to power could sway more people into thinking about how they use energy. Traditional power resources – like coal, natural gas, and nuclear – require a significant amount of water to produce energy: It takes an average of 21 gallons of water to produce one kilowatt-hour of electricity. The average American uses about 900 kWh per month – that’s nearly 19,000 gallons of water per person per month just for electricity! So, every time you turn your lights on, you might as well be turning on the faucet, too. If electric utilities made that connection to customers or policymakers, it could make the reality of our energy behavior more tangible.

Energy efficiency is a great way to reduce customers’ bills, save water, and lower pollution. But if utilities want people to take advantage of their energy efficiency programs, the new study from Pacific Institute for Climate Solutions and ACEEE suggests they should consider strategic tactics and messengers when delivering the critical details surrounding efficiency. One way to enhance engagement could be by emphasizing the inextricable link between energy and water, and helping people understand where their water comes from.

How you use electricity in your own home is a personal decision, but having a deeper knowledge of the impacts of those choices could lead to less energy and water waste – and healthier air for us all.

Photo source: iStock/nicolas_

Read more